Use changes in ESPN win probability to identify influential plays that provide natural event shocks for studying prediction-market behavior.
Sports market machine learning
Sports Prediction Mispricing
Machine learning and time-series models analyzing how NBA prediction markets respond to major in-game win-probability shocks.
Background
Do prediction markets react rationally to major events during NBA games?
Prediction-market prices reflect traders’ expectations about real-world outcomes, but emotionally charged moments may cause markets to respond inefficiently. In NBA games, high-impact plays can produce sudden changes in win probability while simultaneously driving trading activity on prediction markets.
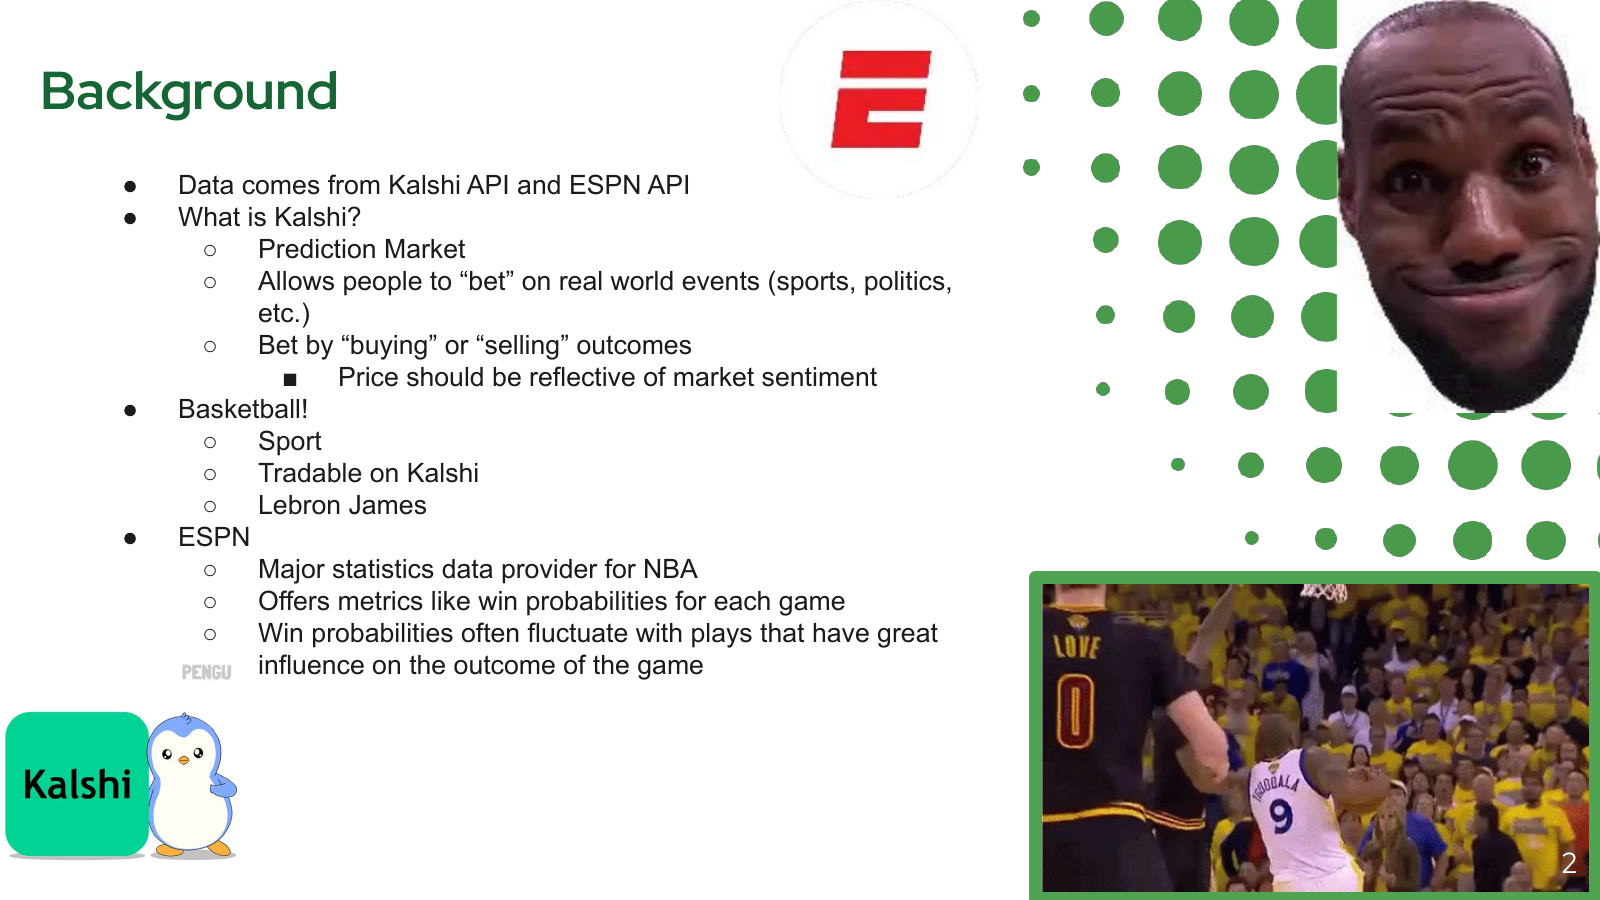
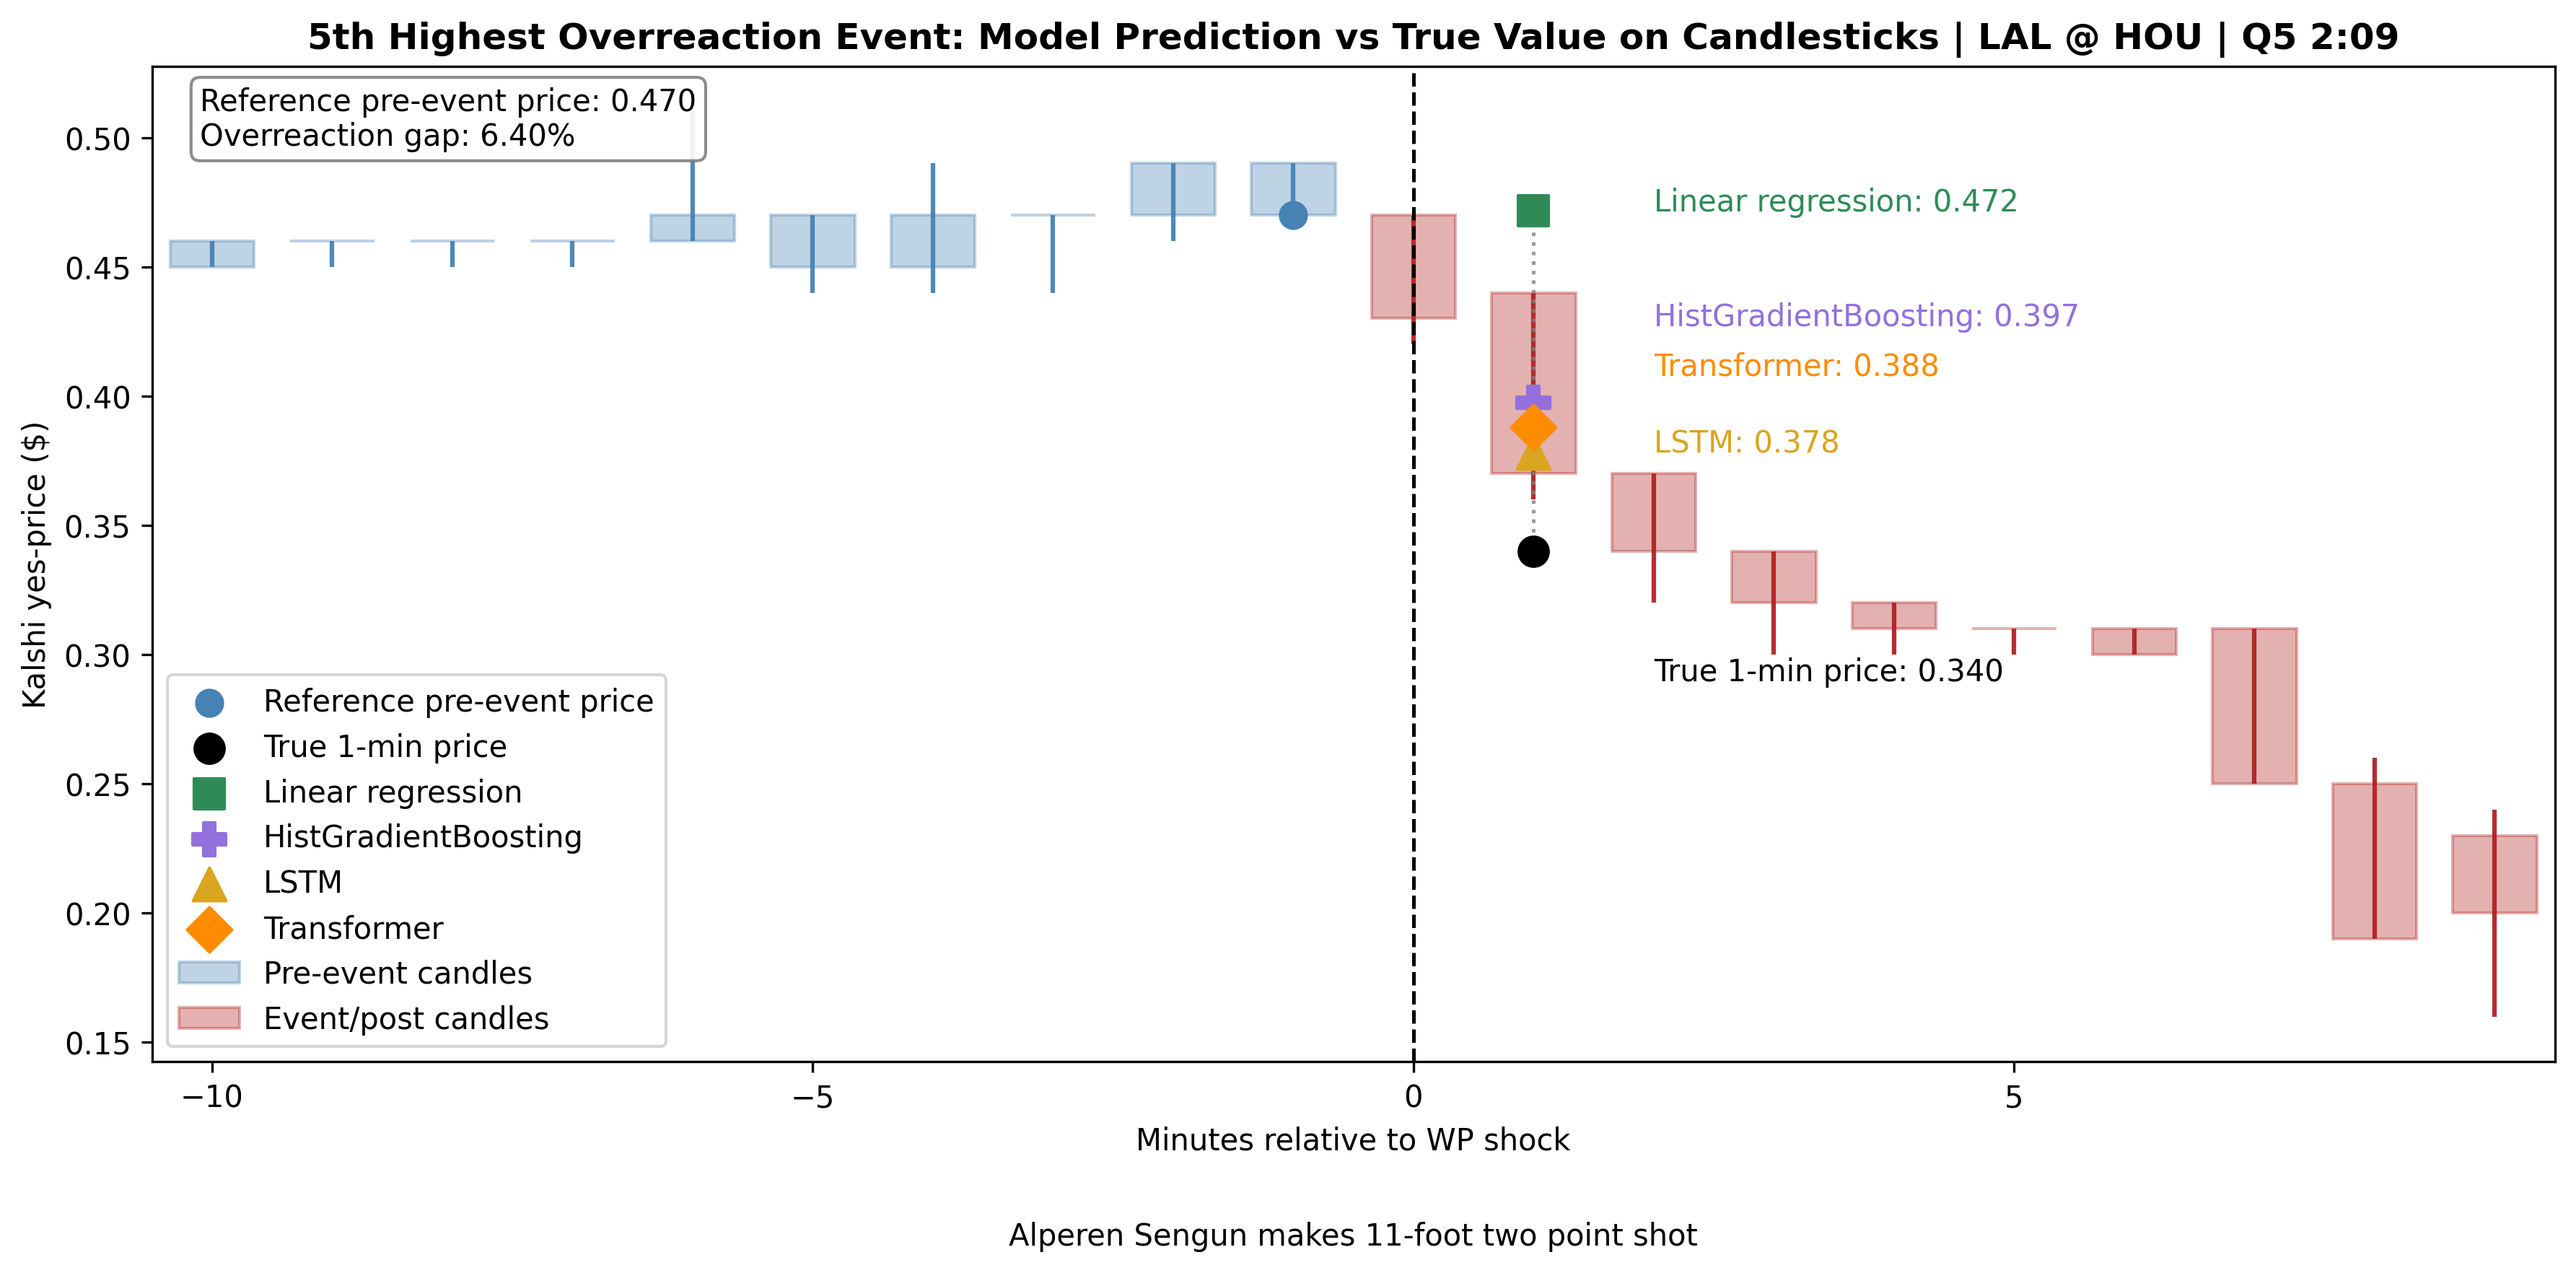
We combined Kalshi prediction-market data with ESPN game and win-probability data to study how market prices adjust after influential plays, whether those adjustments reveal overreaction and mispricing, and whether short-term market responses can be predicted from recent trading behavior.
Project Goals
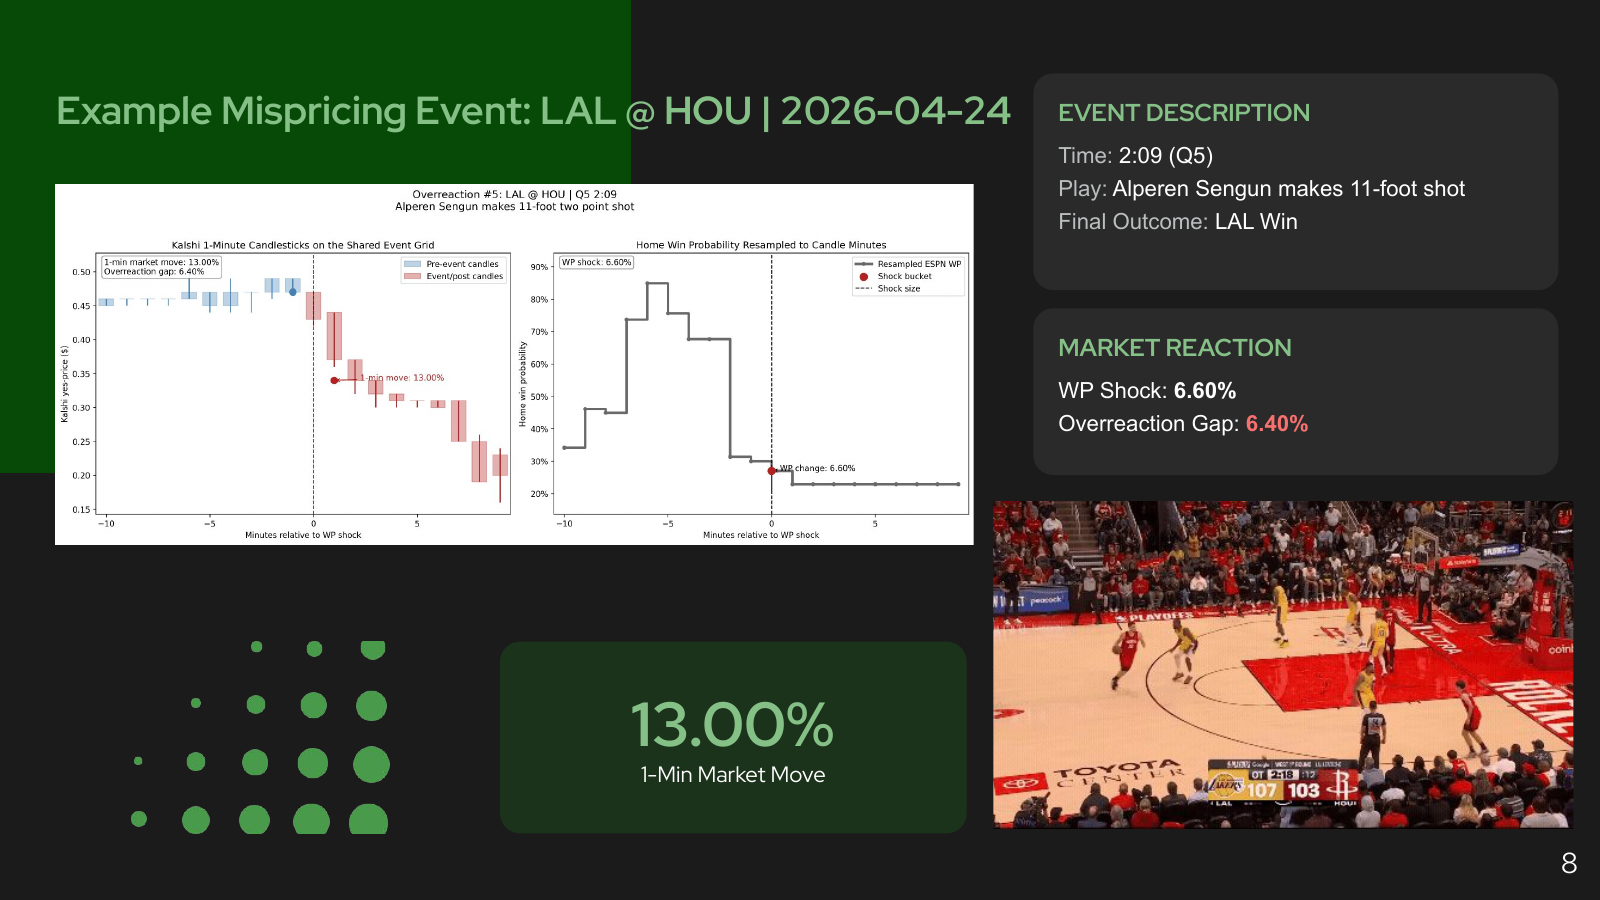
Align each win-probability shock with Kalshi market candles and quantify how prediction-market prices respond immediately after the event.
Compare changes in win probability with corresponding market movements to distinguish appropriate reactions from potential overreactions.
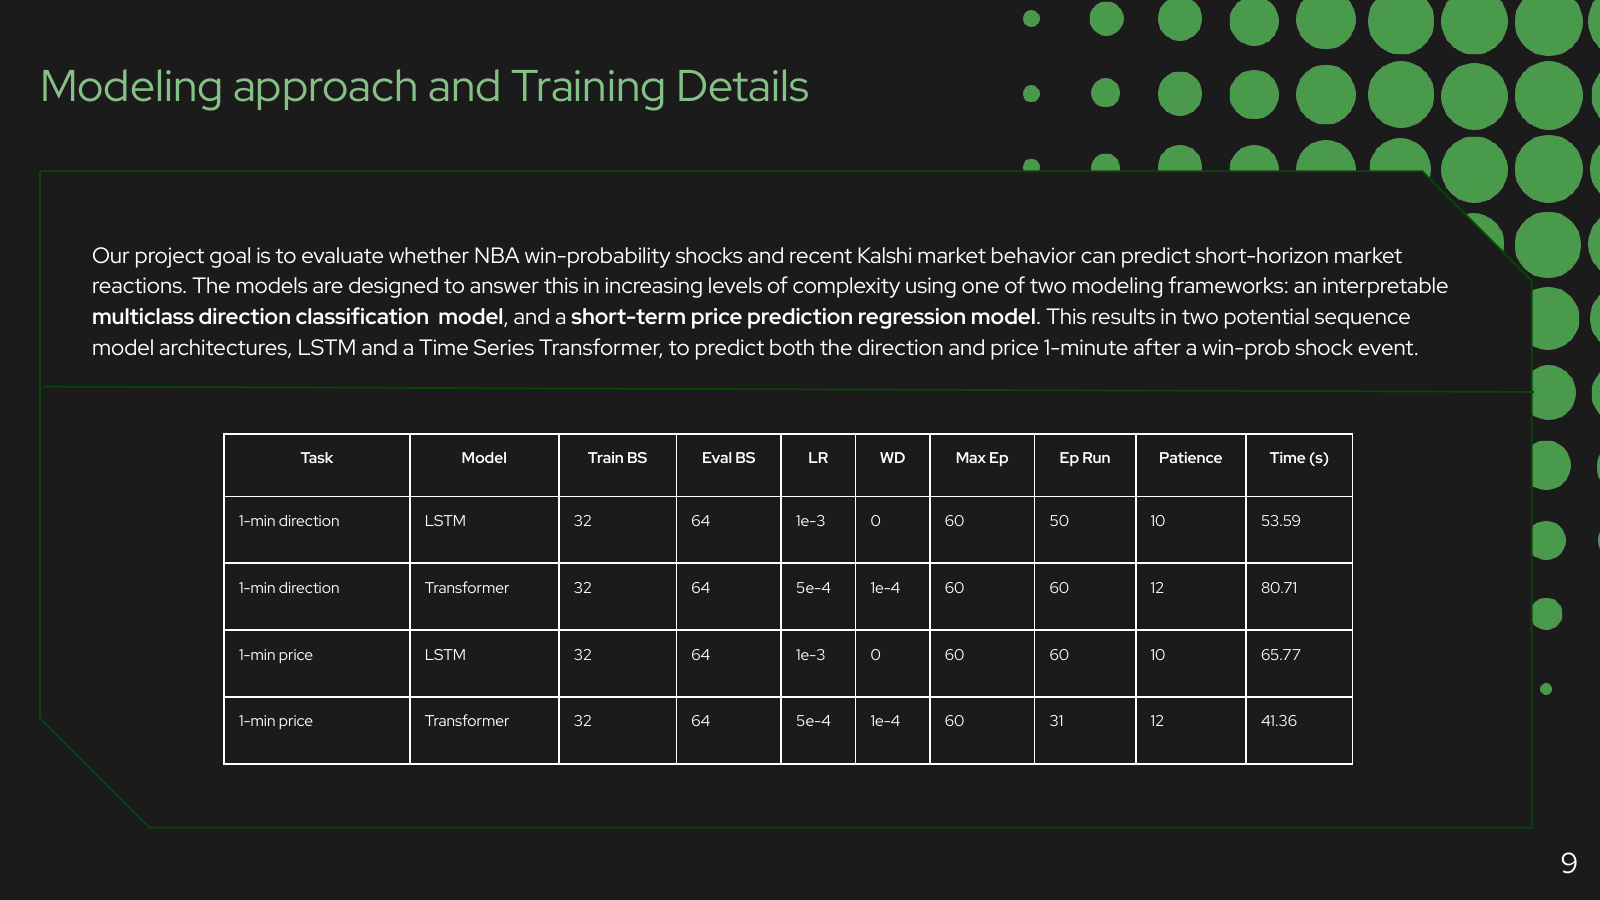
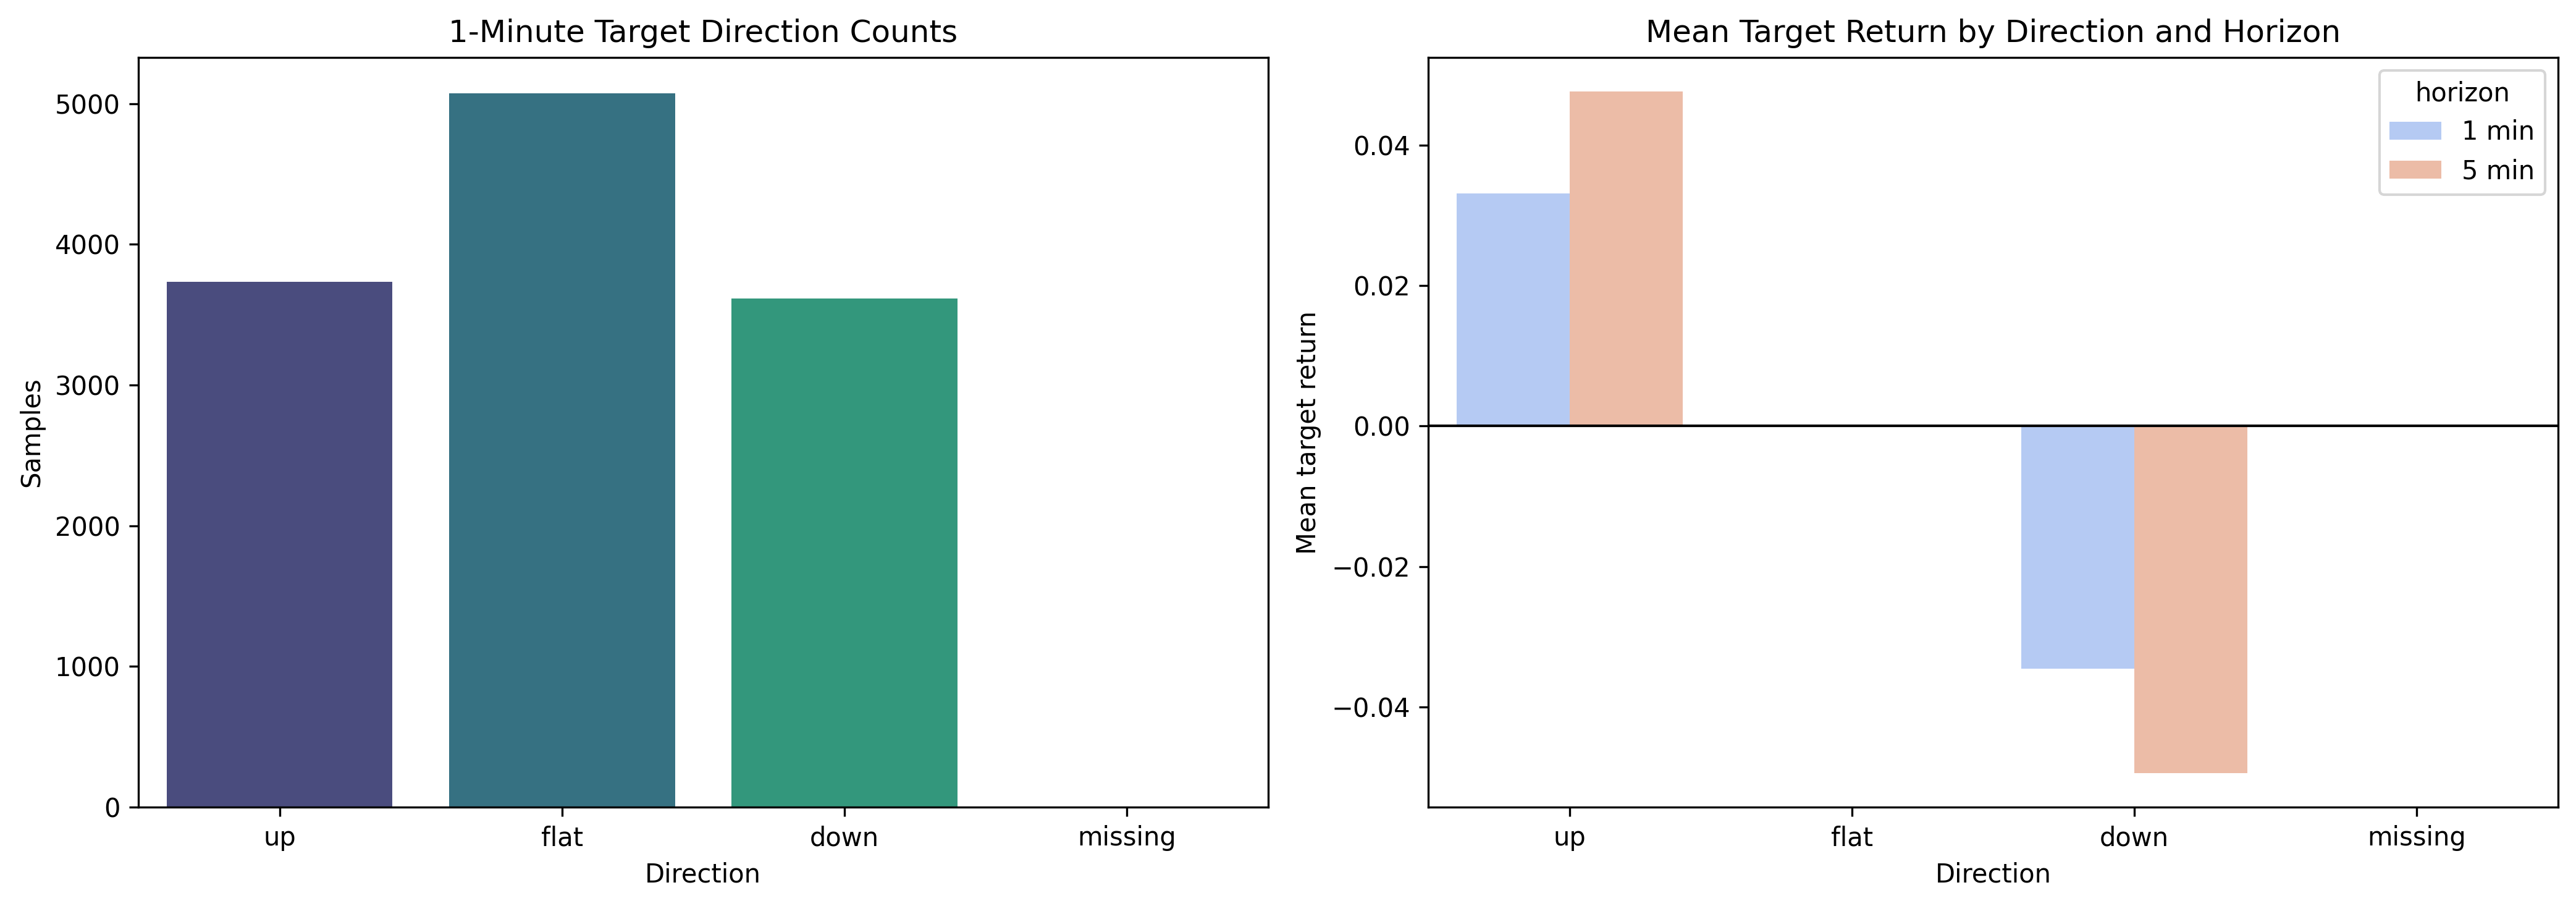
Compare traditional machine-learning baselines with LSTM and Transformer sequence models for predicting market direction and price one minute after a shock.
Project Workflow
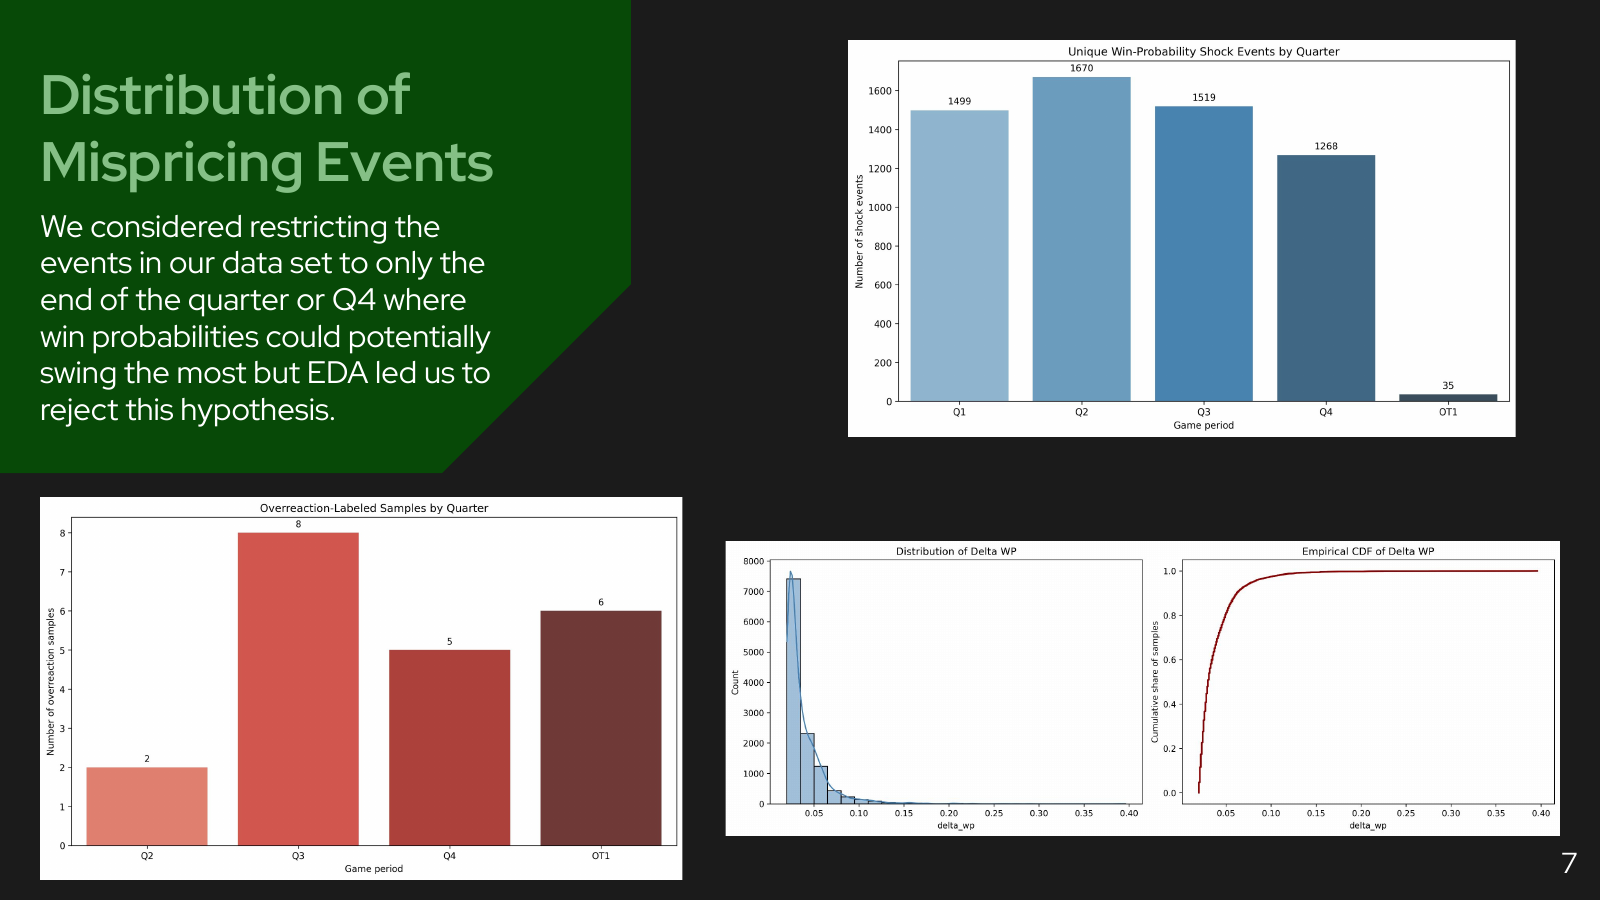
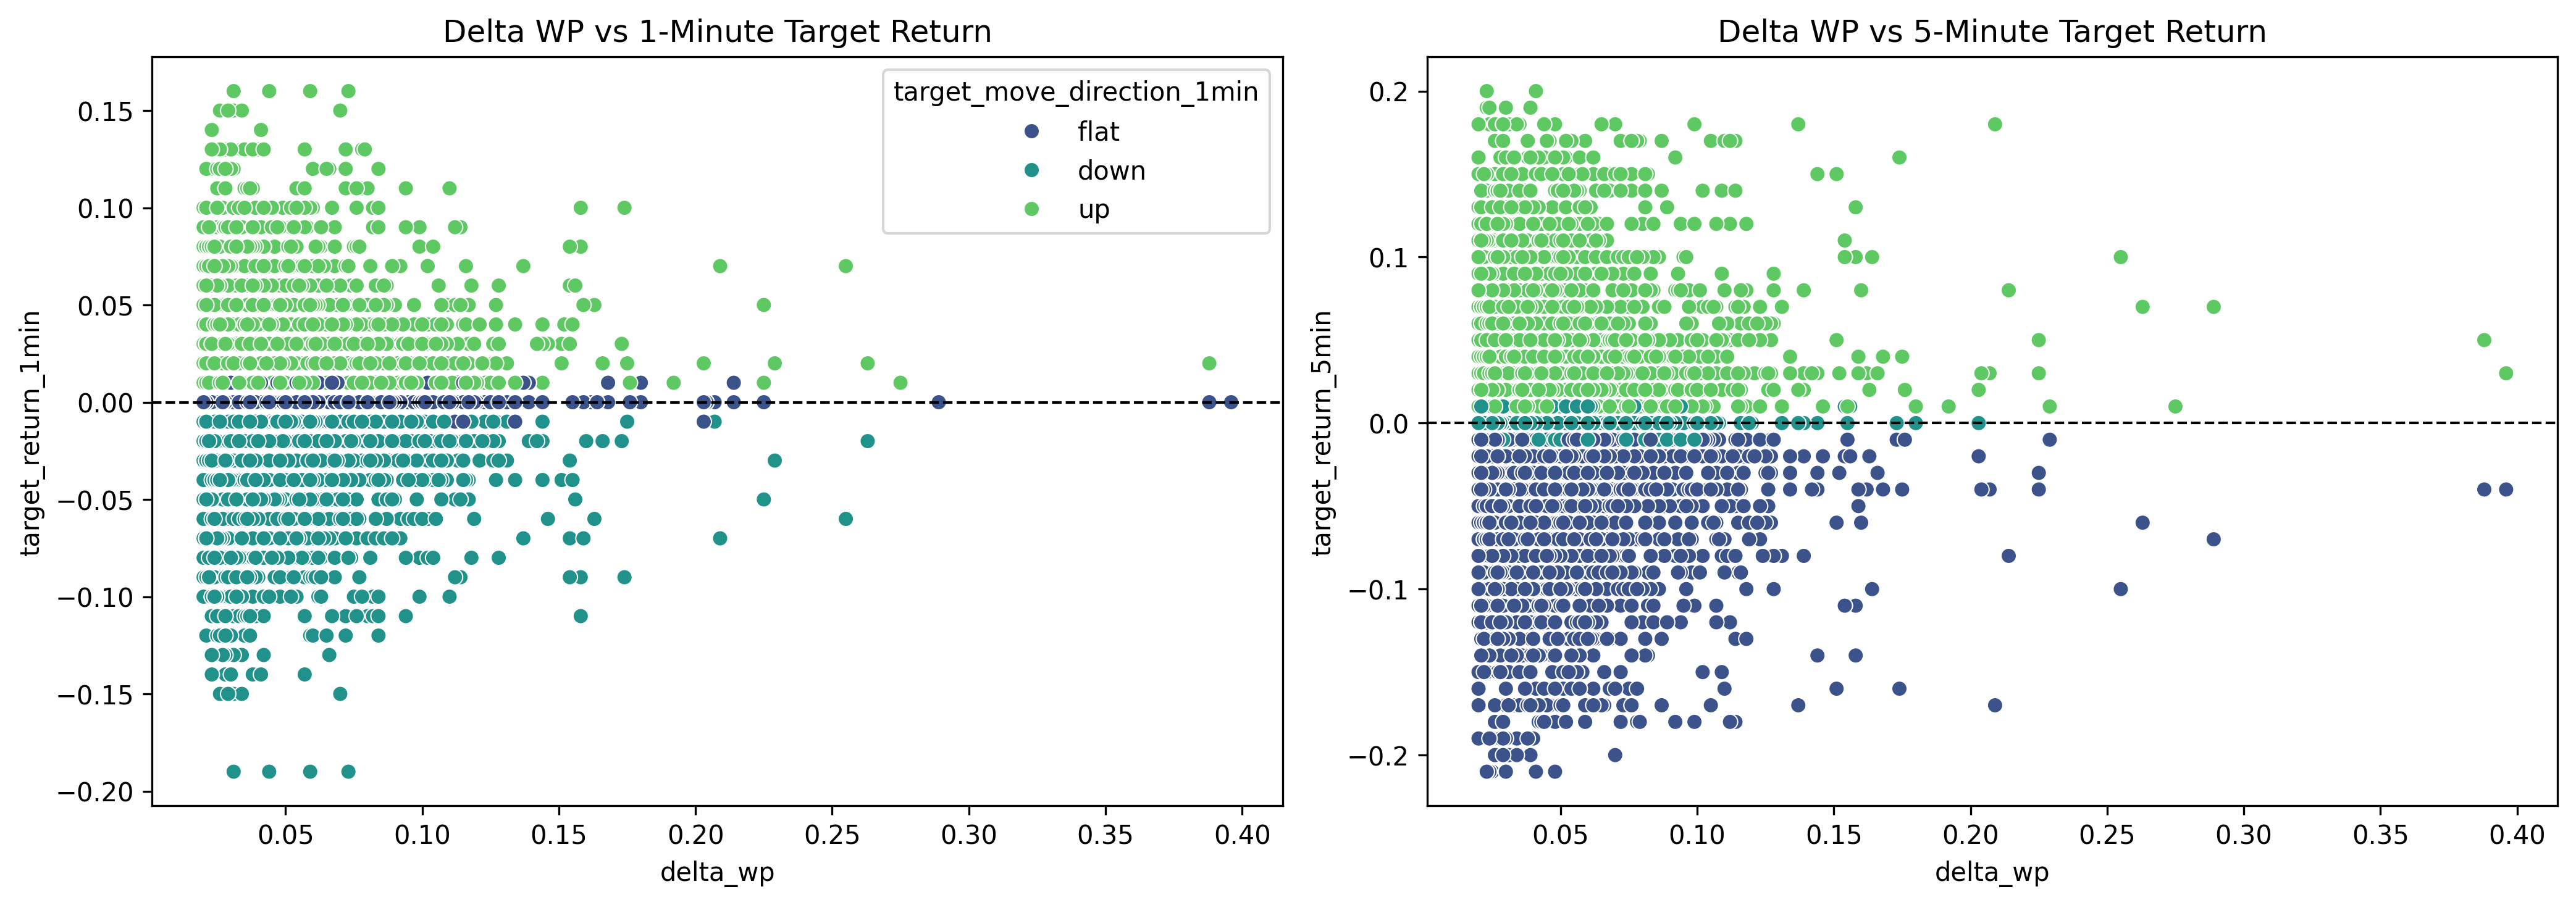
Use ESPN play-by-play data to identify NBA events associated with changes of at least 5% in game win probability.
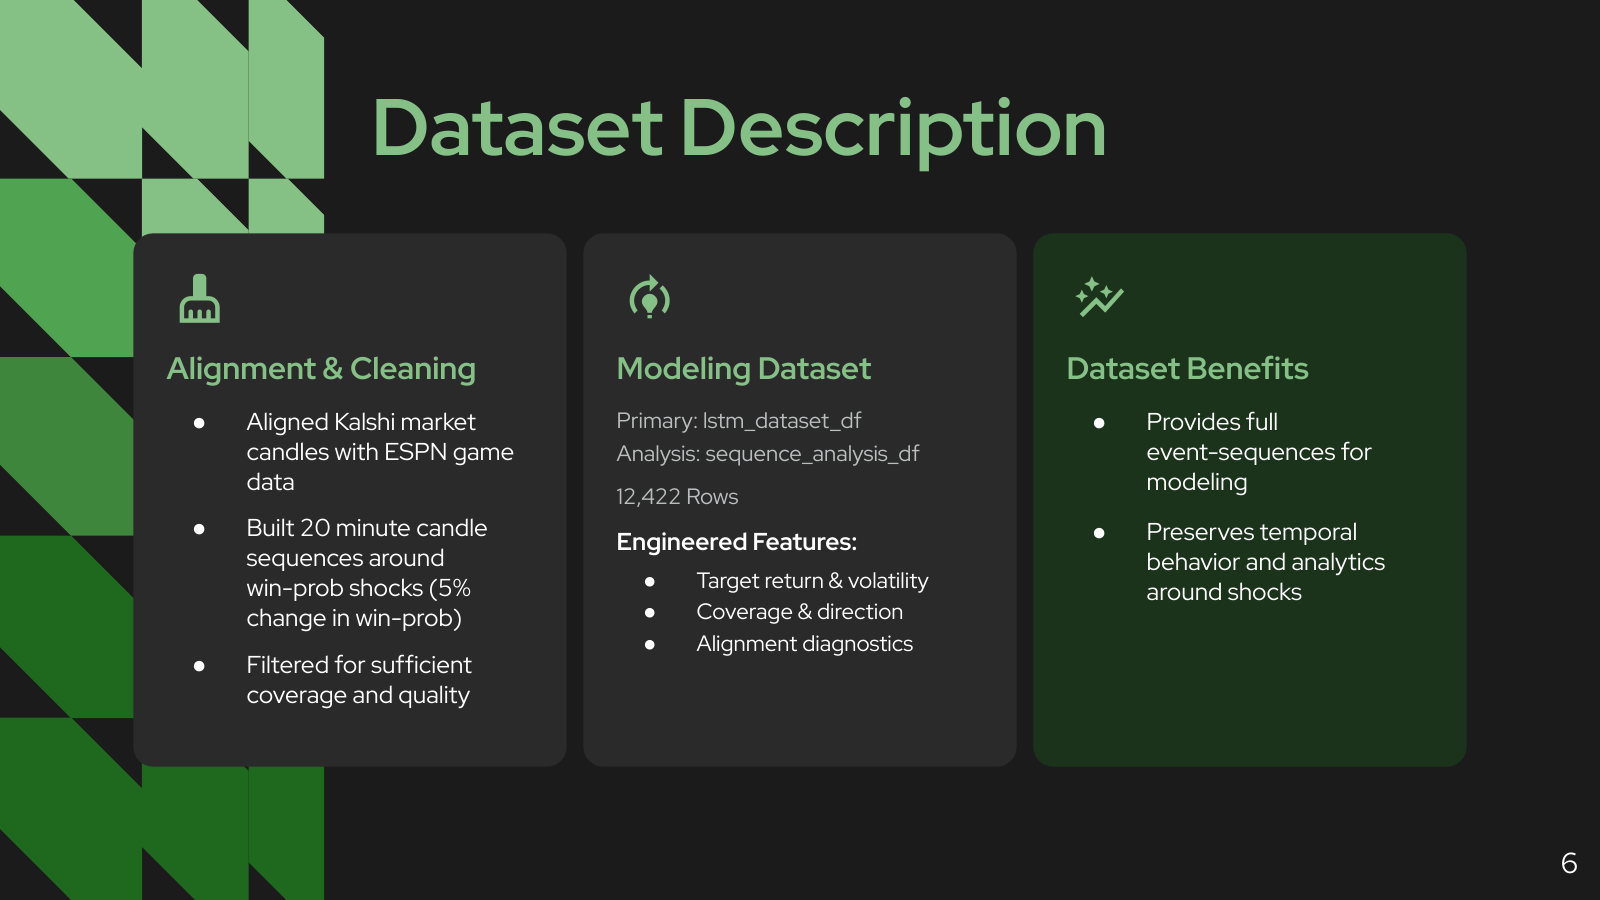
Match ESPN events to Kalshi market candles and filter sequences for sufficient temporal coverage and data quality.
Build 20-minute windows around each shock so models can observe how market prices behave before and immediately after influential plays.
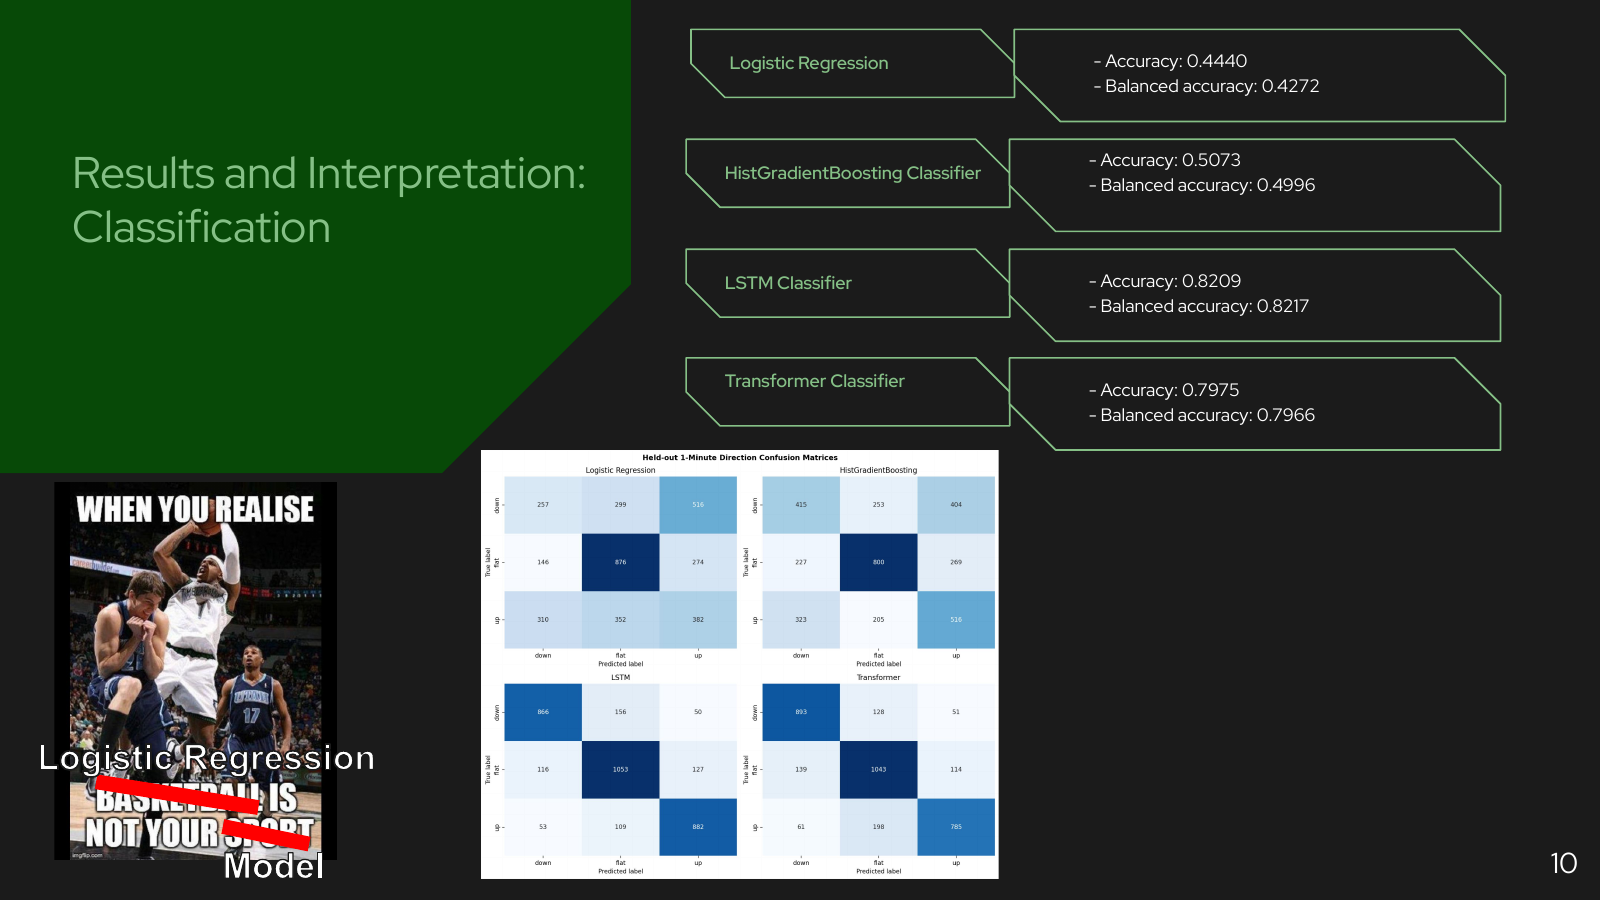
Train Logistic Regression, Histogram Gradient Boosting, LSTM, and Transformer classifiers to predict the direction of the market one minute after an event.
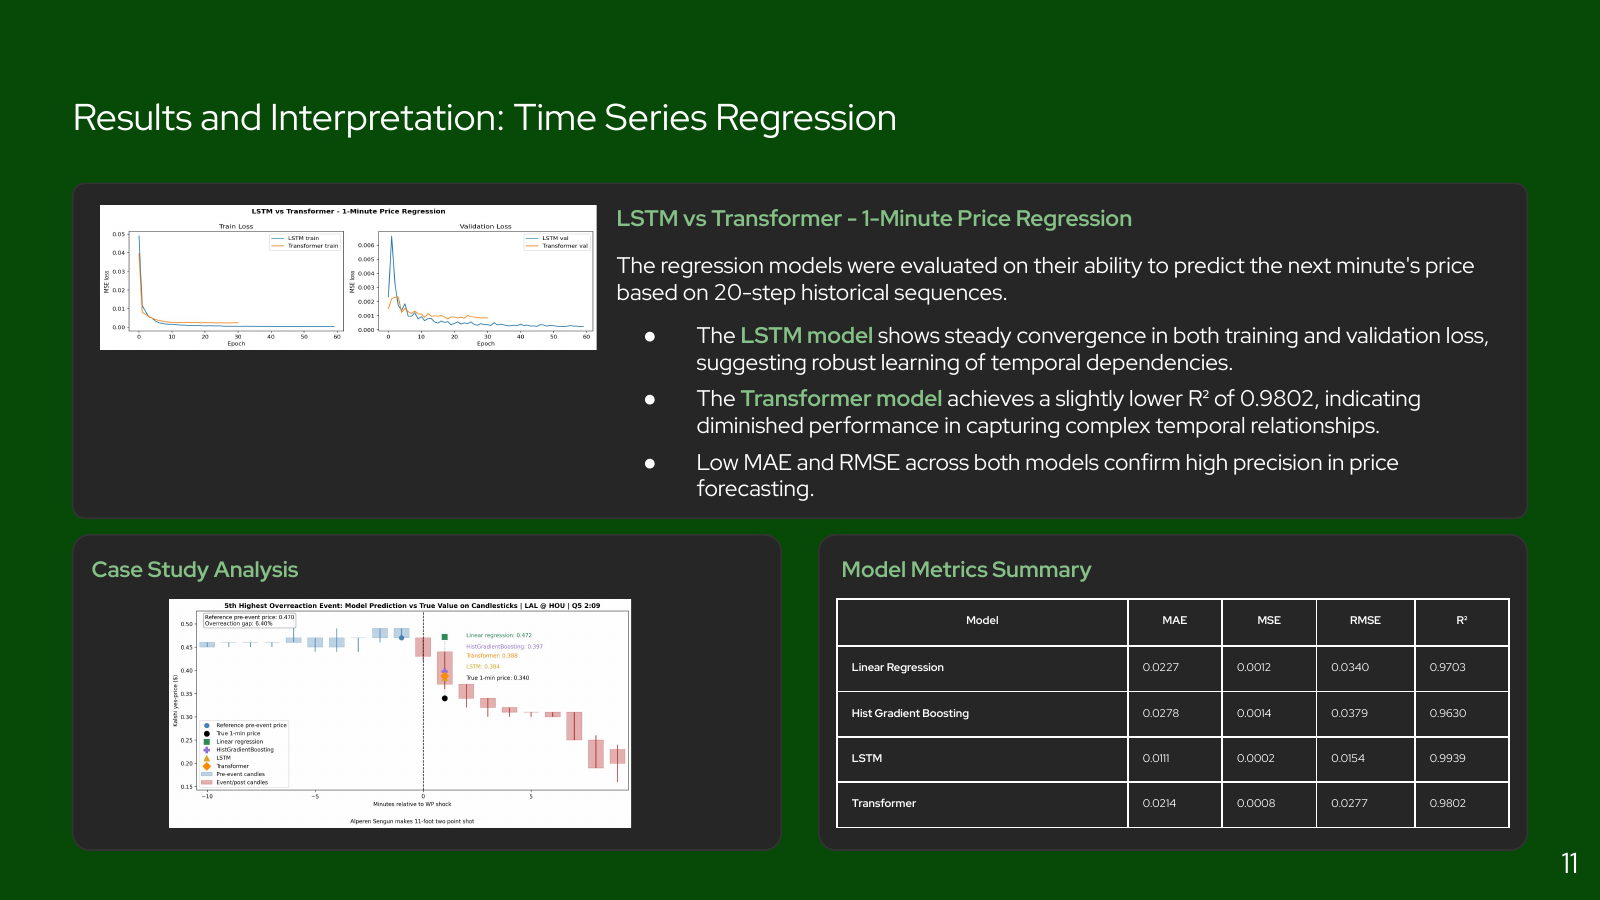
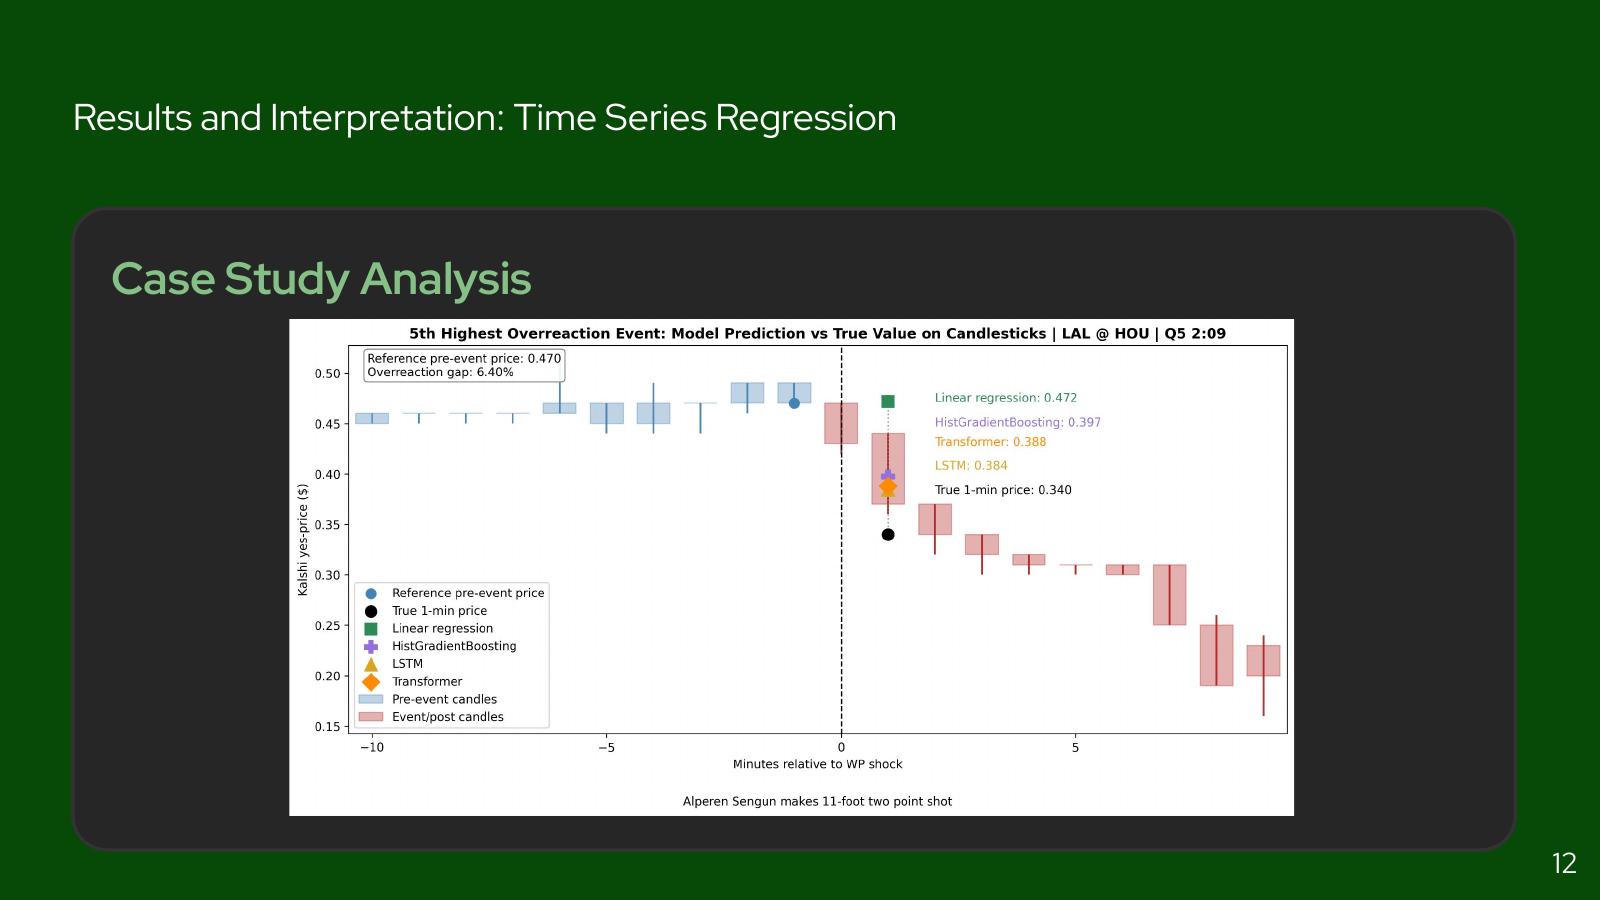
Use linear, gradient-boosting, LSTM, and Transformer regression models to predict the Kalshi contract price one minute after a win-probability shock.
Figures
Selected outputs from the analysis.
Key Result
Sequence models accurately predict short-term Kalshi responses to influential NBA events.
The strongest classification model, the LSTM, achieved 82.2% balanced accuracy when predicting one-minute market direction. For price forecasting, the LSTM achieved an R² of 0.994, outperforming both conventional machine-learning baselines and the Transformer.
Together, the results show that incorporating the temporal structure of prediction-market prices around NBA win-probability shocks substantially improves short-horizon market prediction.
Associated Presentation
Predicting NBA Mispricings: CS 1090B Final Presentation
Final project presentation explaining the Kalshi and ESPN data join, shock-window labeling, sequence-model setup, and overreaction findings.