Use STAR-derived gene counts as the common substrate for filtering, identifier mapping, and differential expression.
RNA-seq bioinformatics
Hypothermia Gene Set Enrichment Analysis
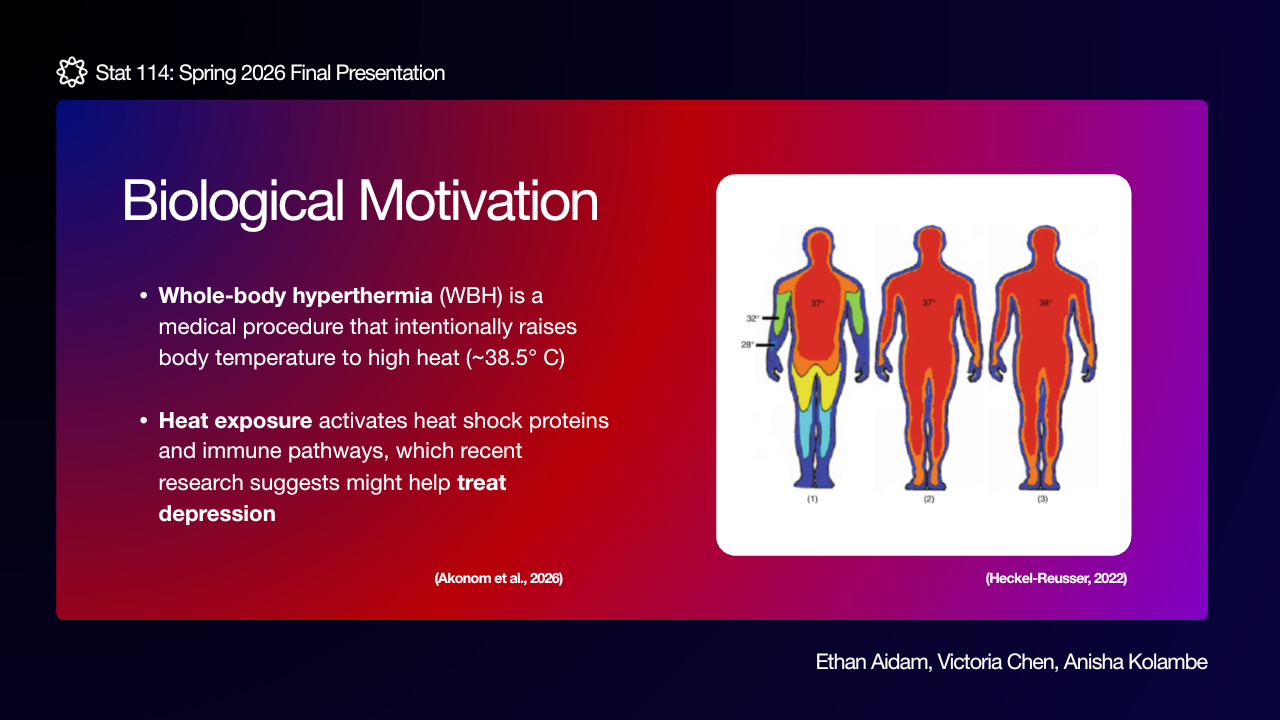
End-to-end RNA-seq and GSEA workflow for whole-blood samples exposed to temperature stress.
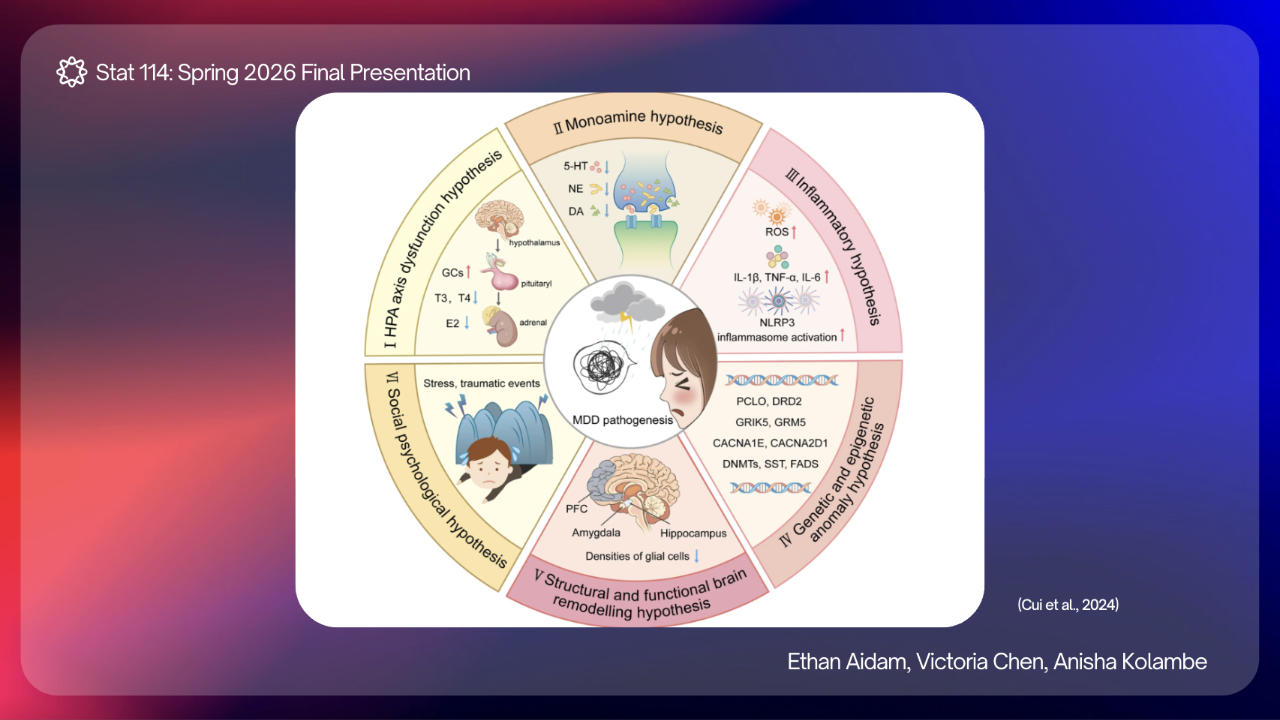
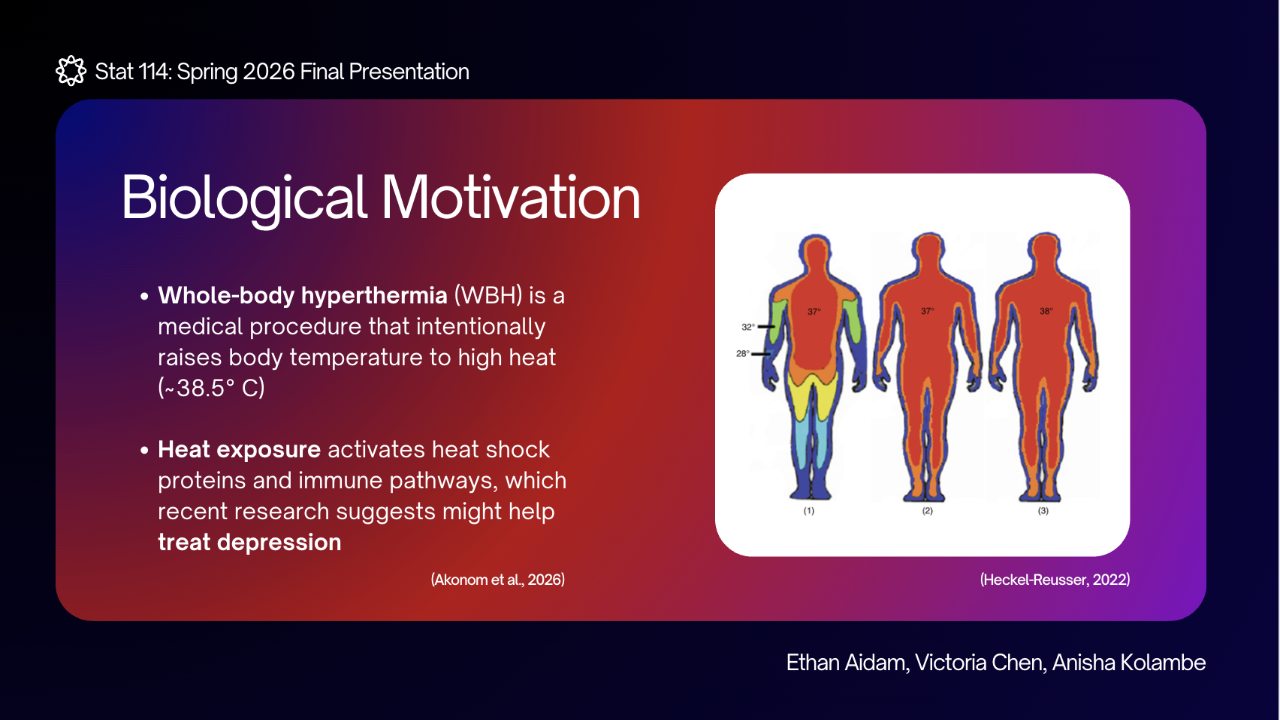
Background
Whole-blood expression data needed a reproducible analysis path from alignment through pathway-level interpretation.
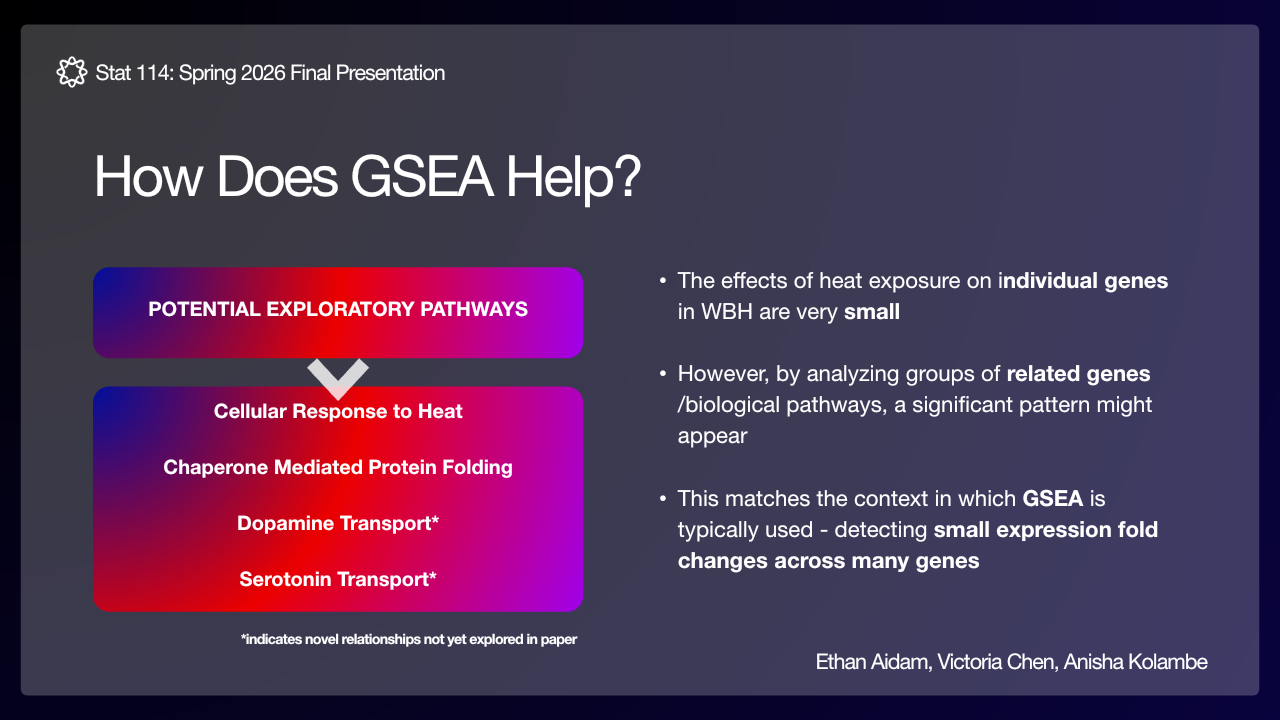
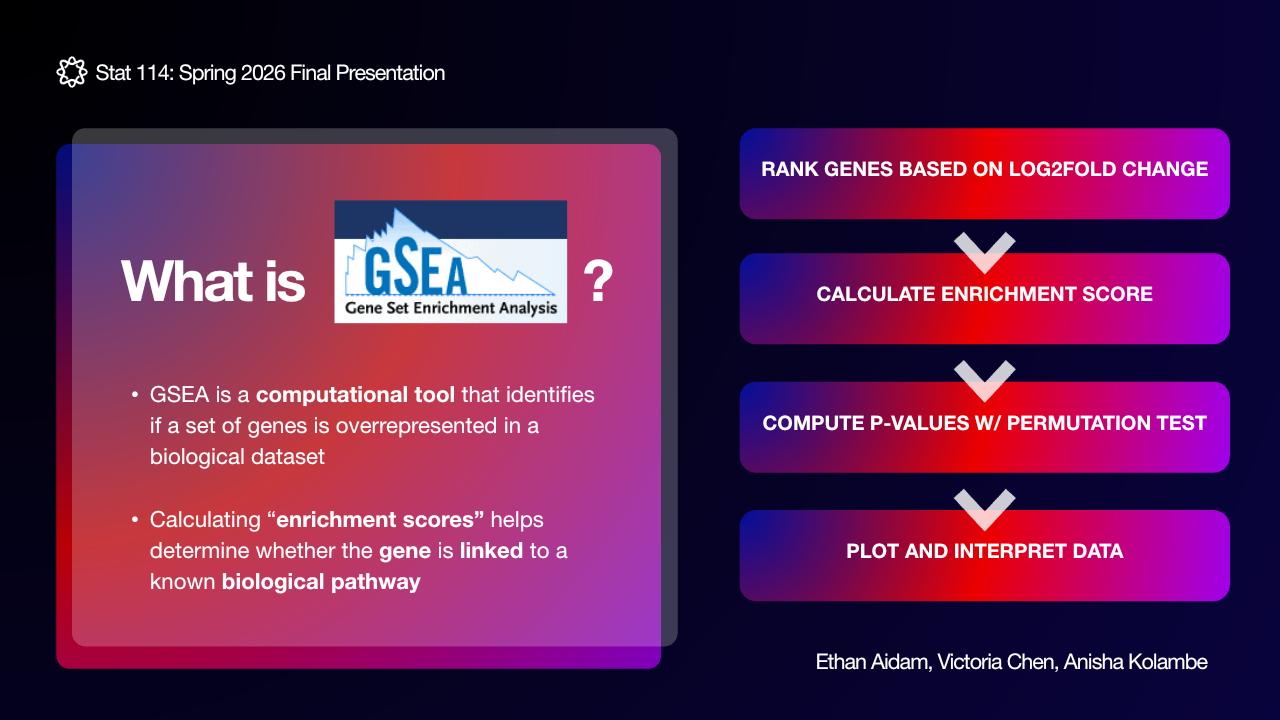
Gene Set Enrichment Analysis asks whether groups of biologically related genes cluster near the top or bottom of a ranked differential-expression list. Instead of interpreting thousands of genes one at a time, the analysis moves up to pathways and cellular programs.
The important reading move is to compare direction, magnitude, and uncertainty: which pathways have positive or negative normalized enrichment, where the running-score curve peaks, and whether the adjusted p-value supports a confident interpretation.
Project Workflow
Use DESeq2 log2 fold change for WBH versus sham to create the ordered list consumed by the custom GSEA statistic.
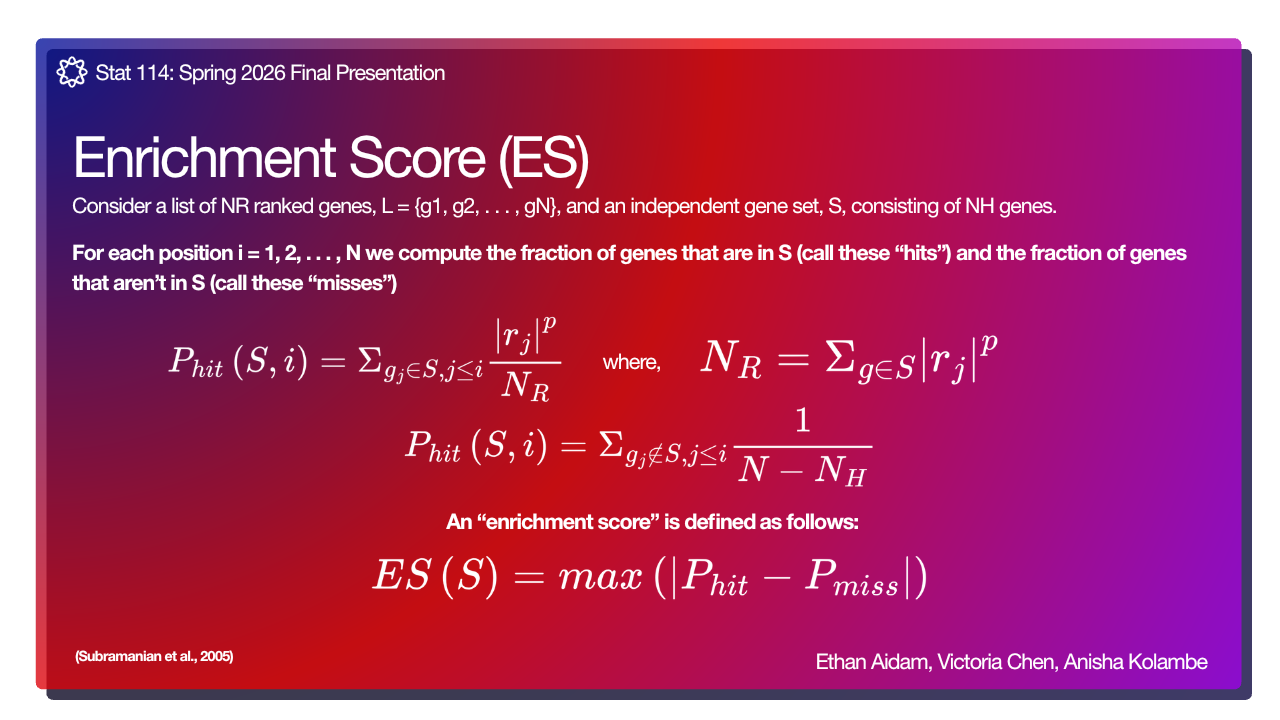
Walk down the ranked list, increasing the running score on gene-set hits and penalizing misses to find the maximum enrichment deviation.
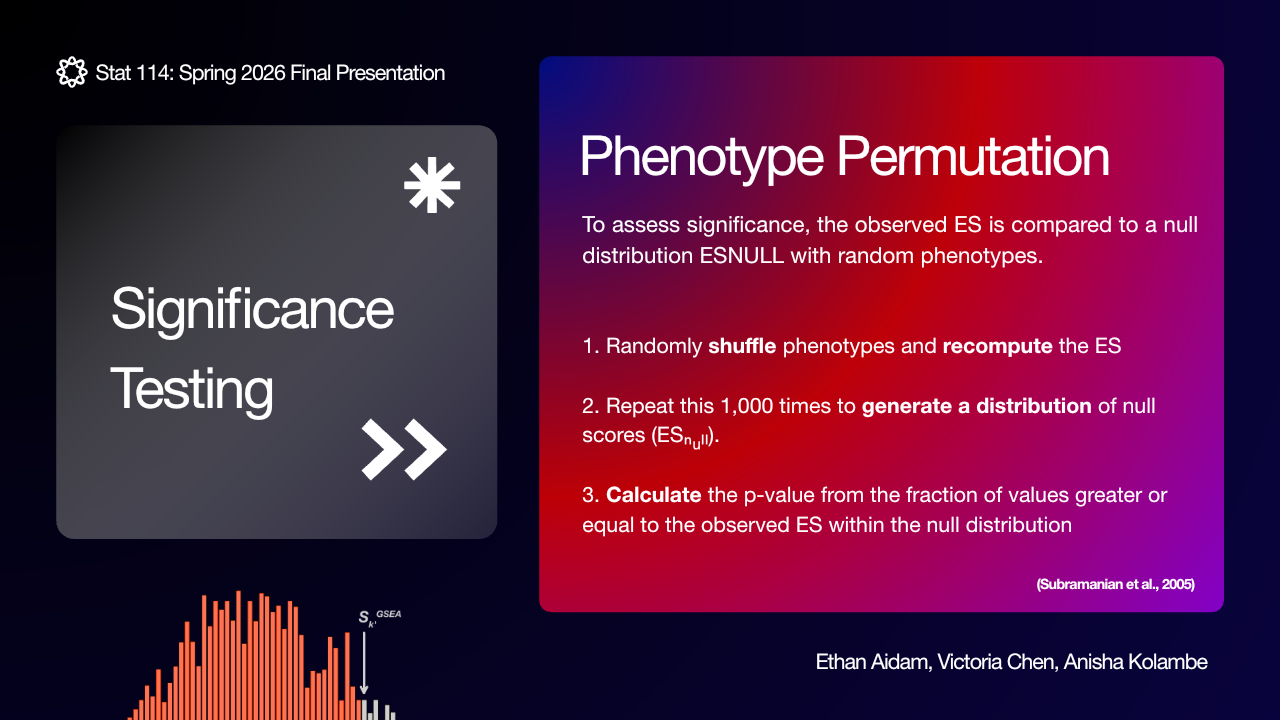
Use phenotype-label permutations to estimate NES and p-values, then compare trends to Broad GSEA results.
Pipeline
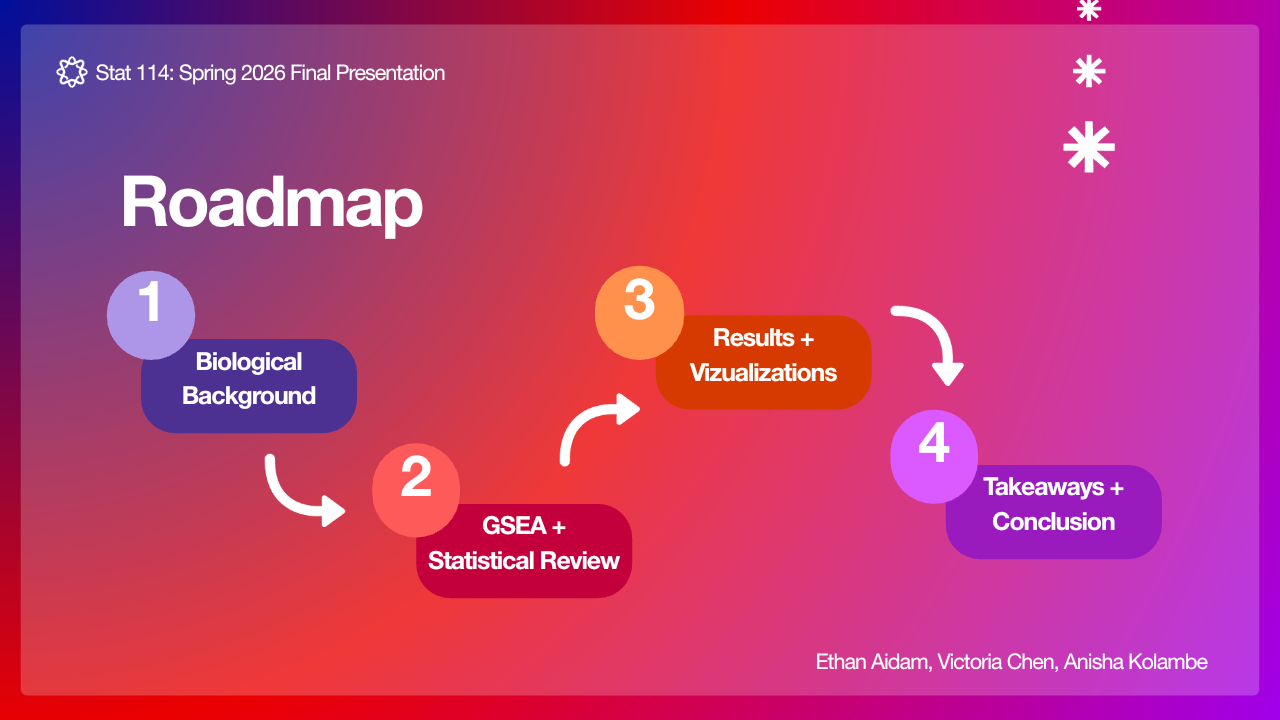
From sequencing reads to pathway scores.
The analysis moves from count data to ranked treatment contrasts, then asks whether predefined gene sets appear unusually early or late in that ranked list.
Download paired sequencing files by SRR accession.
Run FastQC to inspect read quality before alignment.
Align reads and produce gene-level count outputs.
Model WBH versus sham and rank genes by log2 fold change.
Compute running ES, NES, empirical p-values, and adjusted p-values.
Compare custom results with preranked desktop analyses.
Metric Definition
NES means normalized enrichment score.
The normalized enrichment score rescales a pathway's raw enrichment score against a permutation-based null distribution. That normalization makes gene sets with different sizes easier to compare, while the sign still shows which end of the ranked contrast contains the pathway genes.
Enrichment Direction
Pathway signal is read by direction and magnitude.
Positive scores indicate concentration toward the top of the ranked WBH-versus-sham contrast; negative scores indicate concentration toward the opposite end.
Running Score
The curve shows where enrichment accumulates.
A peak early in the list means pathway genes appear disproportionately near the top-ranked genes.
Result Table
Magnitude and uncertainty should be read together.
ES is the raw enrichment score, NES is the normalized score, and adjusted p-value accounts for testing multiple pathways.
| Gene set | ES | NES | Adj. p | Genes |
|---|---|---|---|---|
| Heat Shock Proteostasis | 0.215 | 1.103 | 0.844 | 293 |
| Interferon Signaling | -0.153 | -0.720 | 0.910 | 374 |
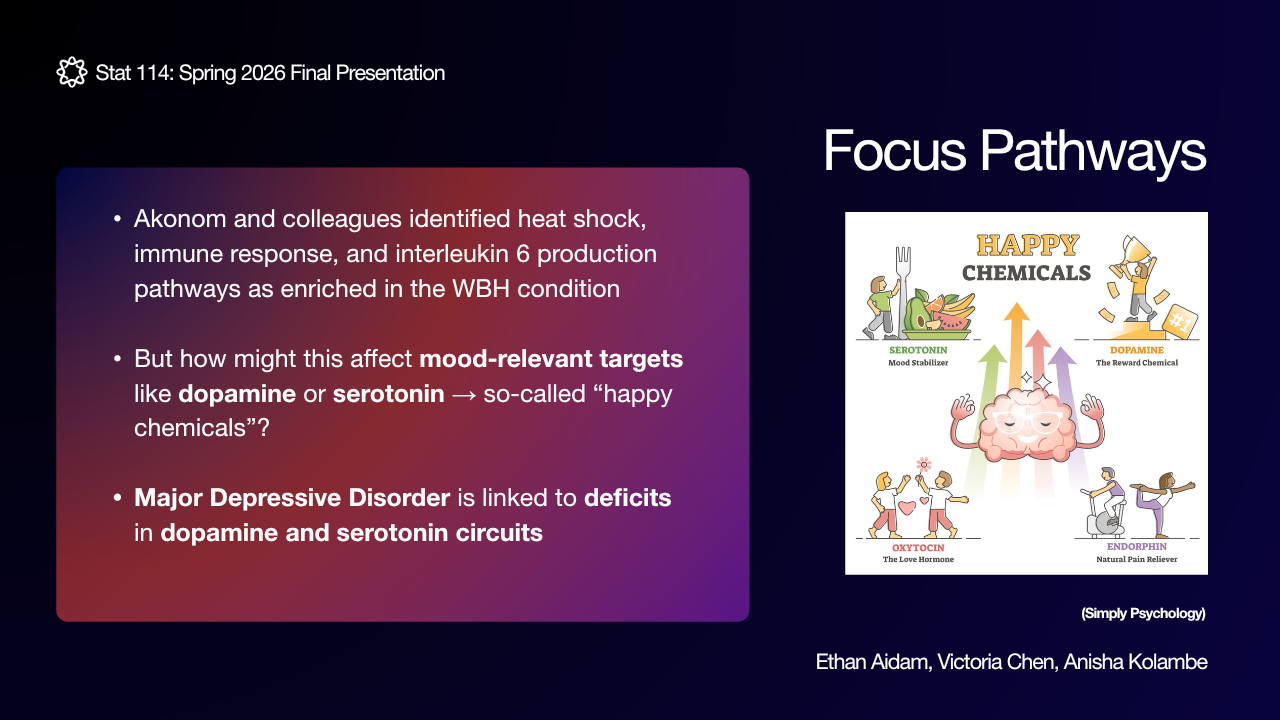
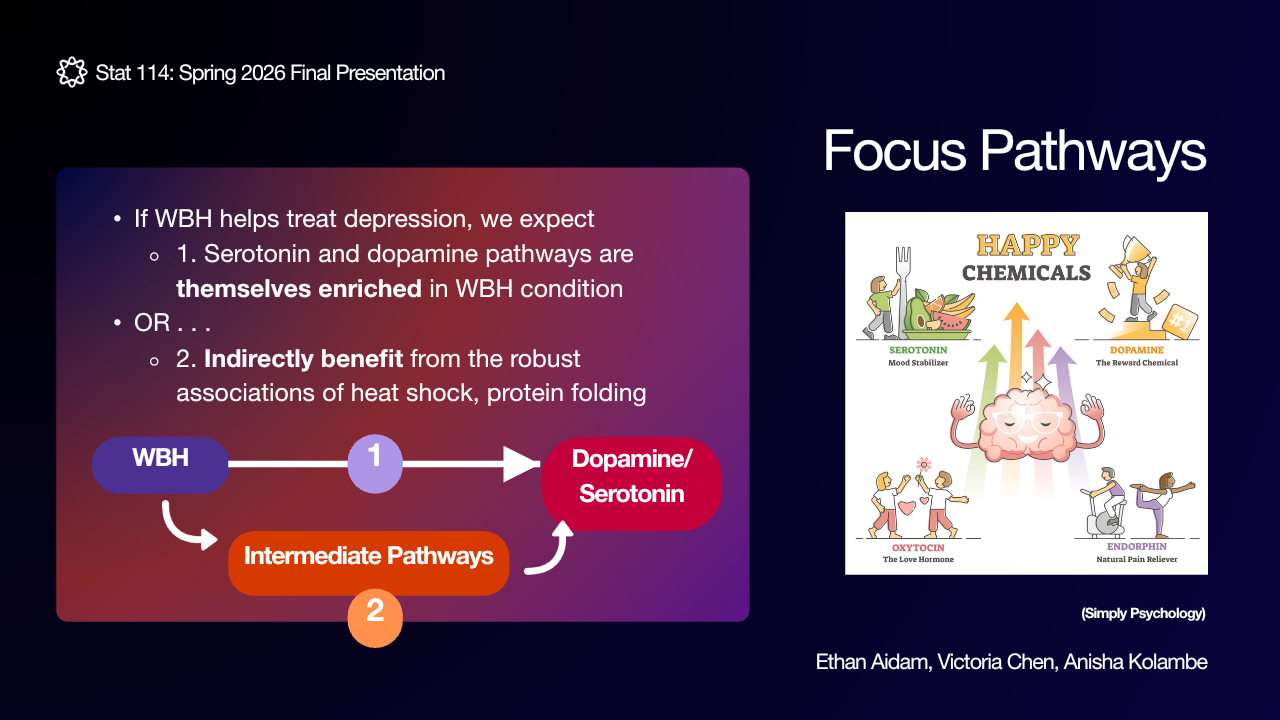
| Serotonin | -0.463 | -0.960 | 0.910 | 46 |
| Dopamine | -0.541 | -1.020 | 0.910 | 131 |
Associated Presentation
STAT 114 Hypothermia GSEA Final Project
Final presentation for the RNA-seq and gene set enrichment analysis project, including workflow and biological interpretation.