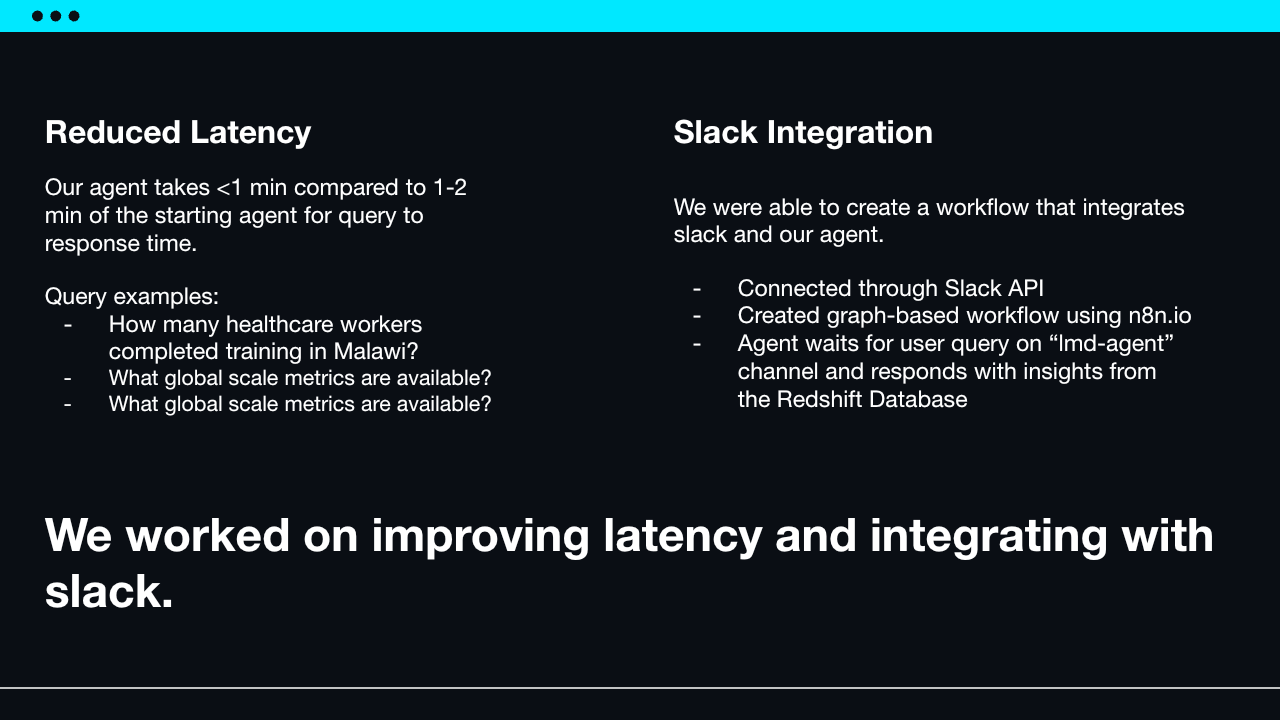
Cache database schema and query context to reduce the time required to answer common operational and KPI questions.
Global health analytics
Last Mile Health KPI Agent
LangGraph multi-agent text-to-SQL system for querying global health KPI data in natural language.
Currently Closed SourceBack to portfolio

Background
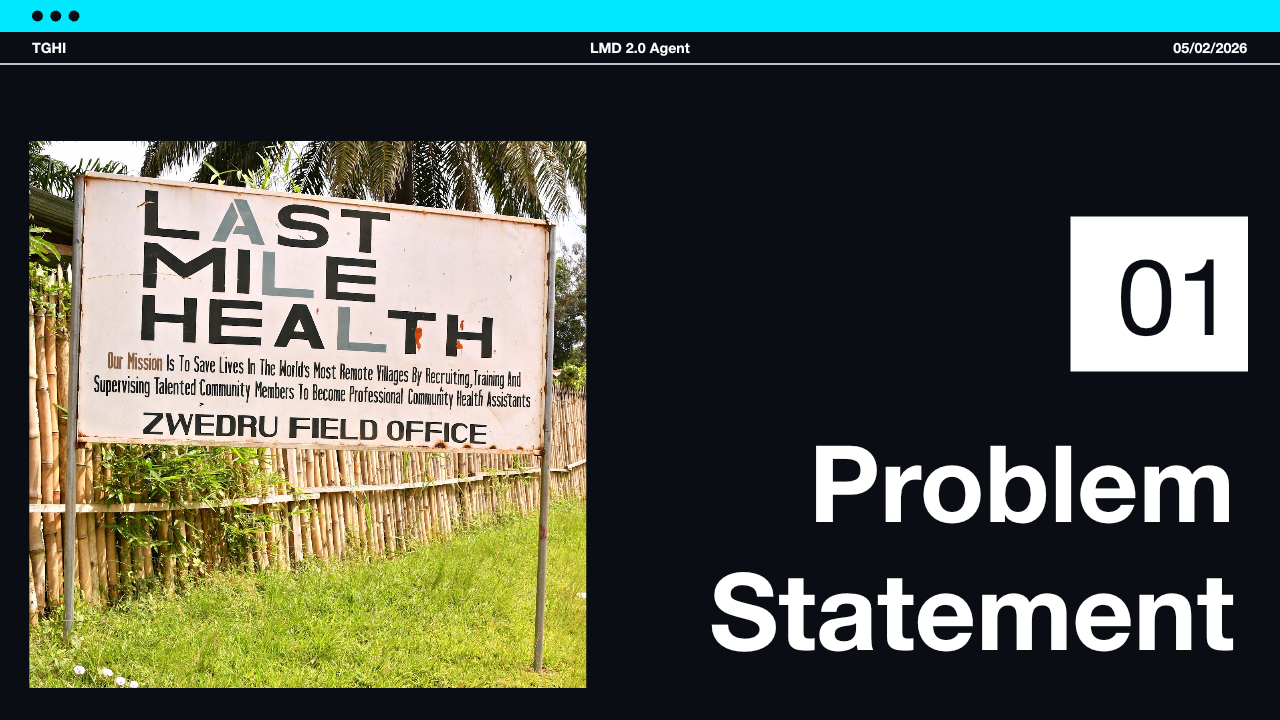
Last Mile Health needed a faster, more accessible way for staff to analyze community health data without manually querying its data warehouse.
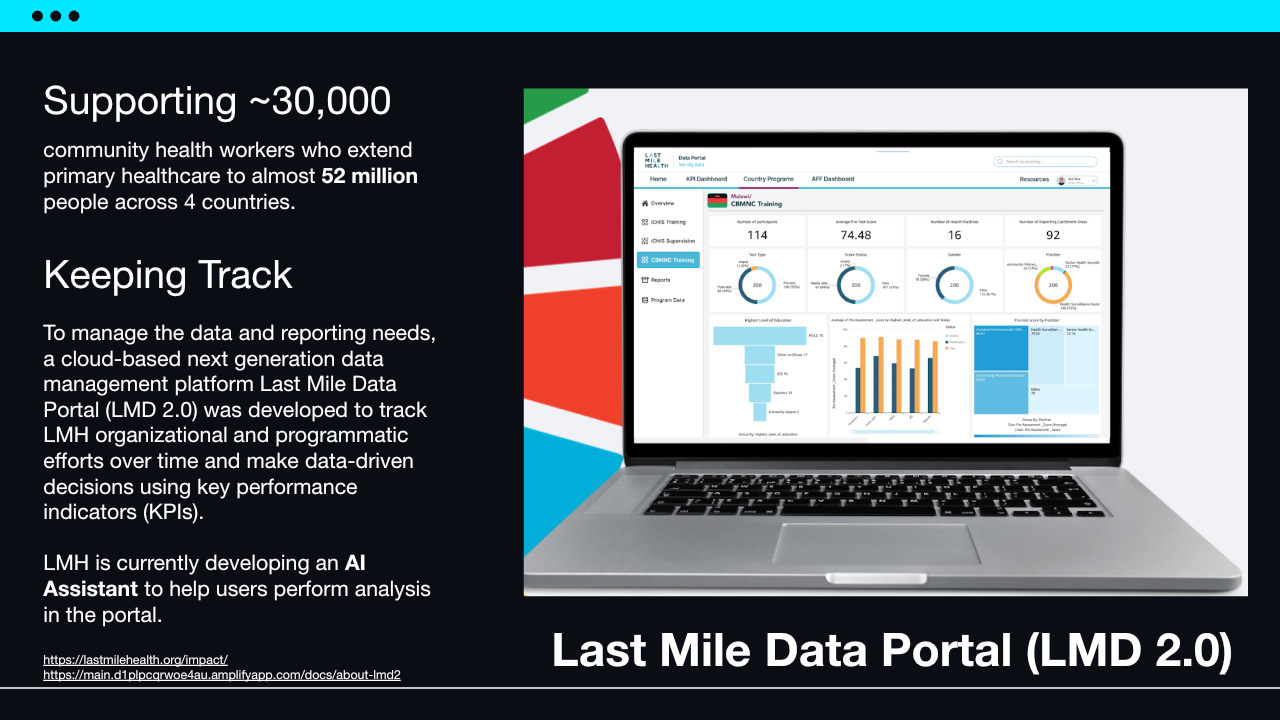
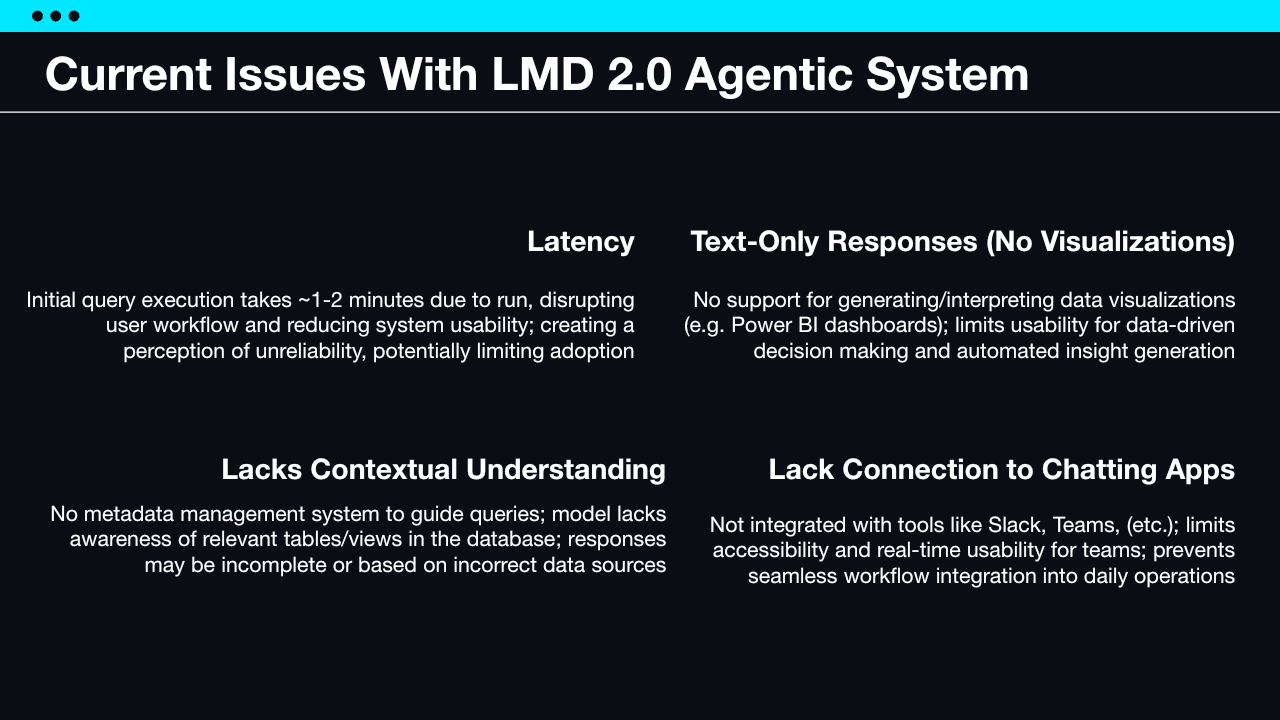
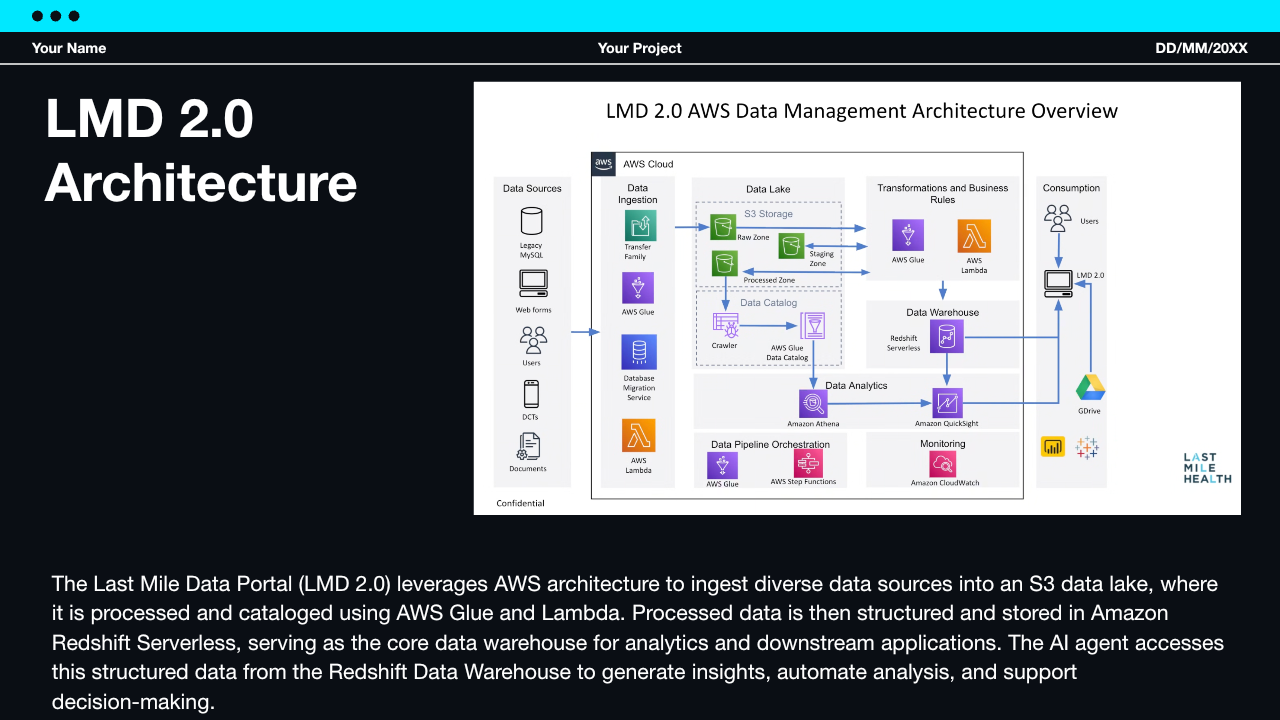
LMD 2.0 tracks program data supporting ~30,000 community health workers across four countries. Its AI agent was designed to make this data accessible through natural-language questions, but 1-2 minute response times and limited database context produced slow and sometimes unreliable answers, limiting its usefulness for staff
Project Goals
Ground SQL generation in relevant database schema, validate generated queries, and automatically correct fixable query errors.
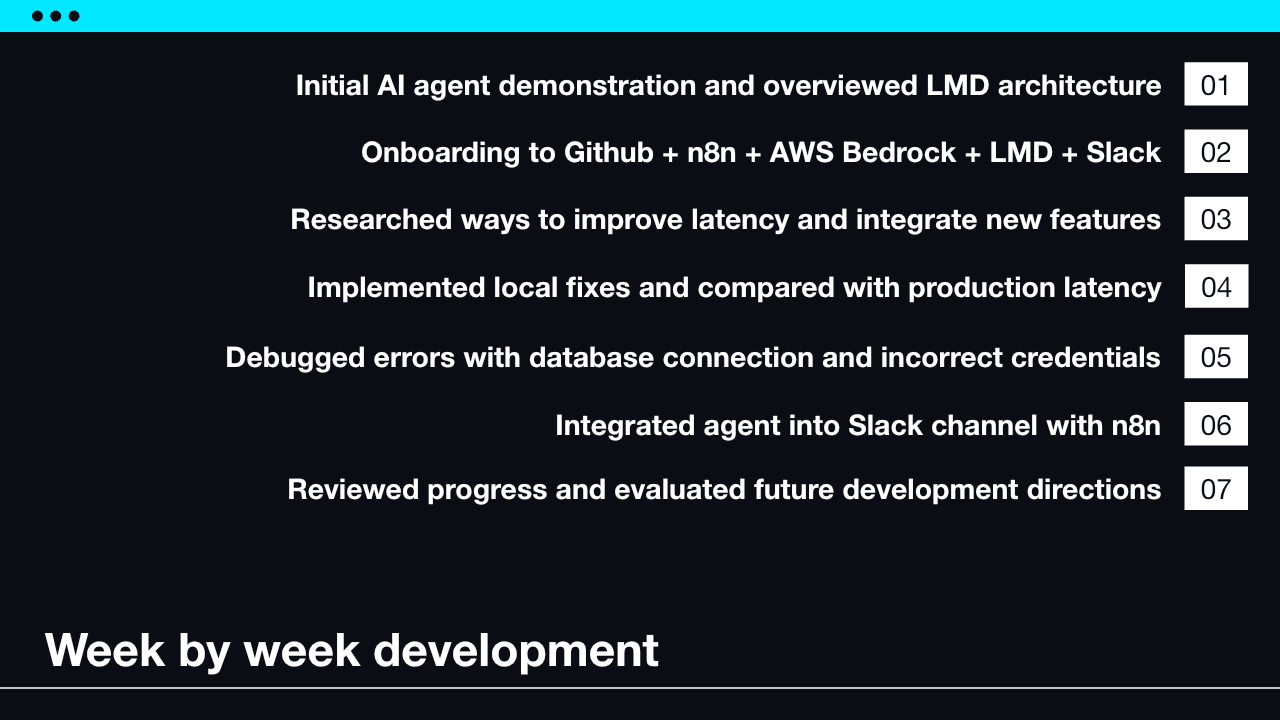
Bring the AI agent into staff workflows by enabling teams to query LMD 2.0 data directly through Slack.
Planning Artifacts
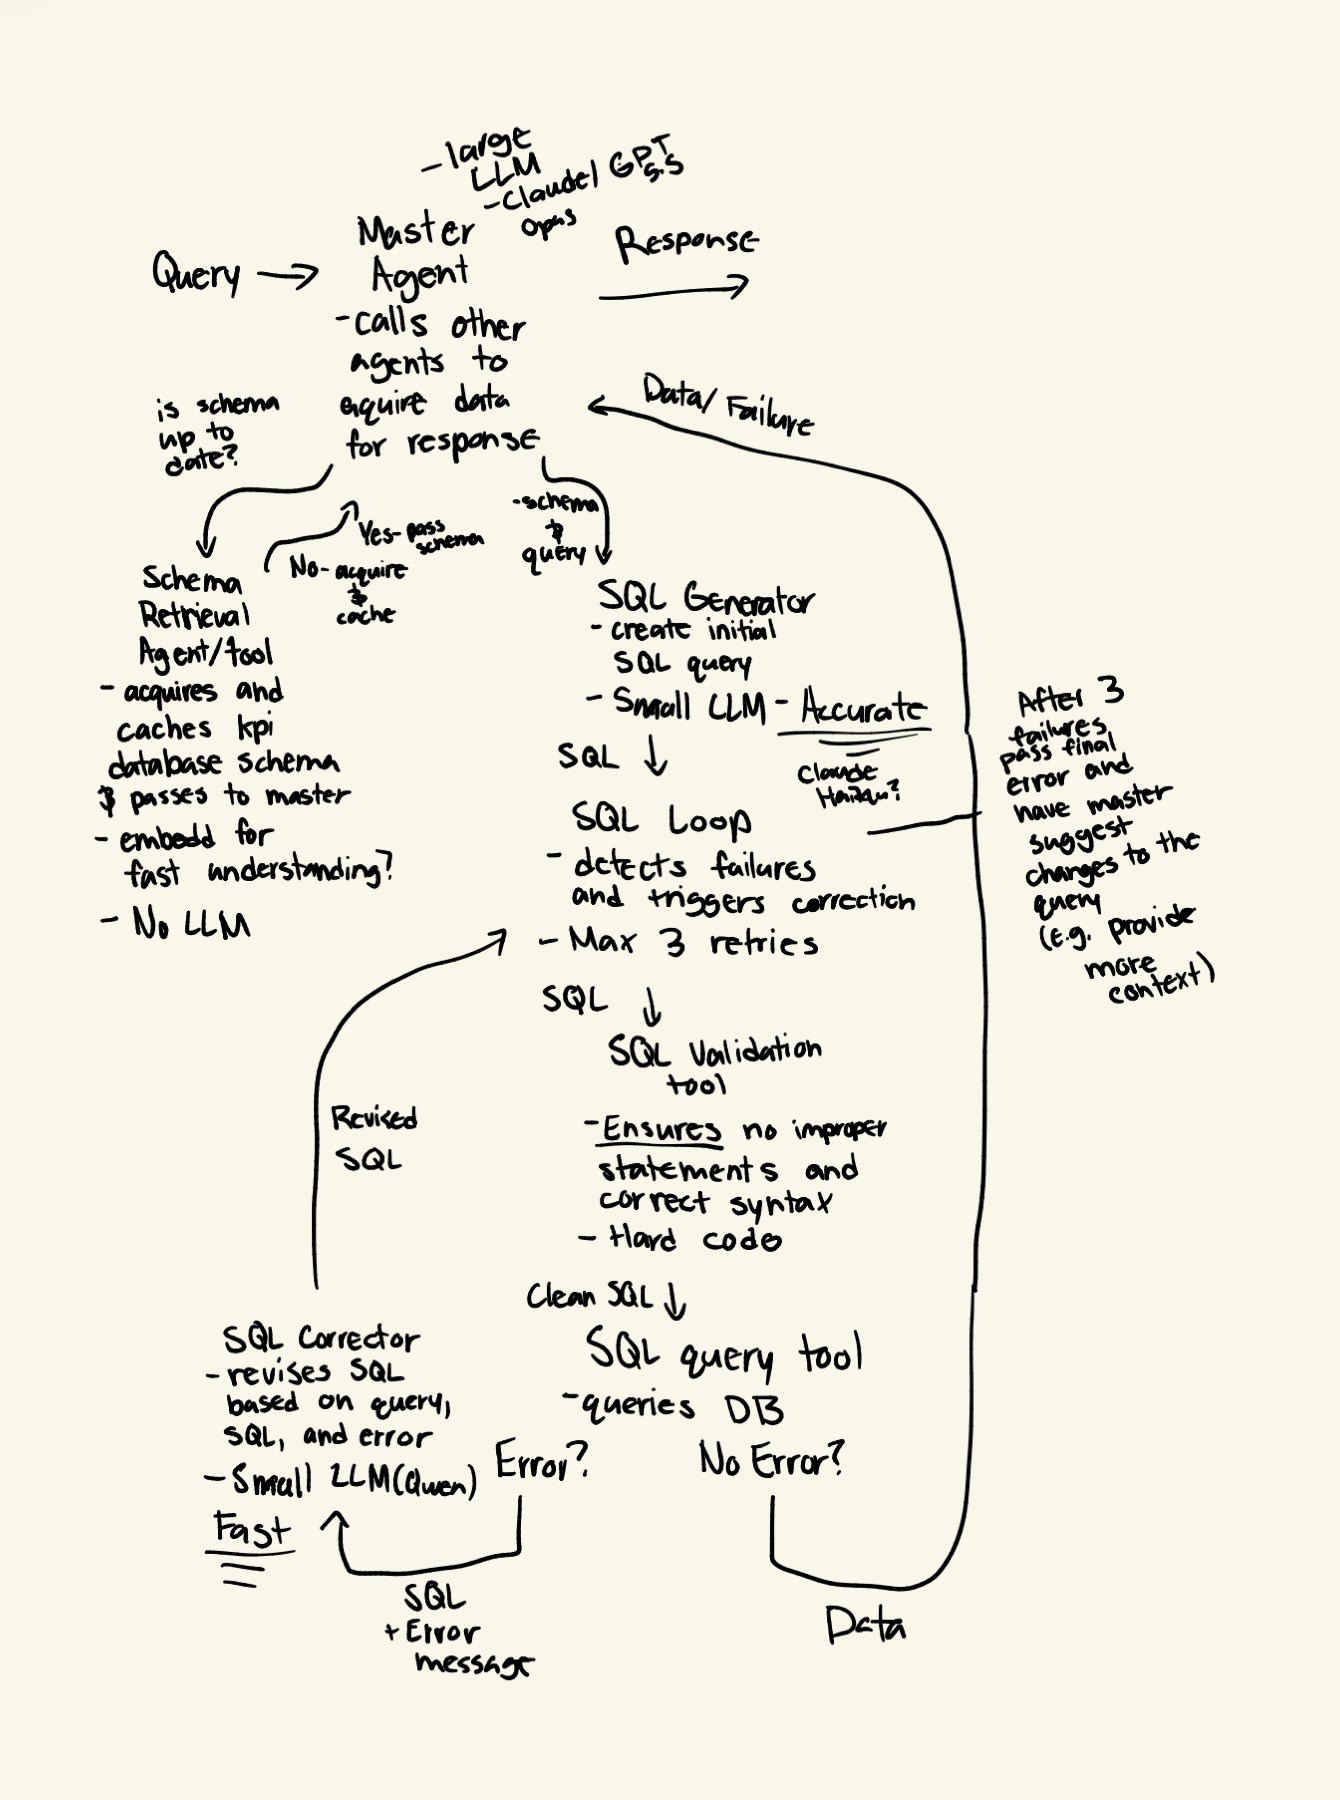
Architecture moved from hand sketch to workflow mockup.
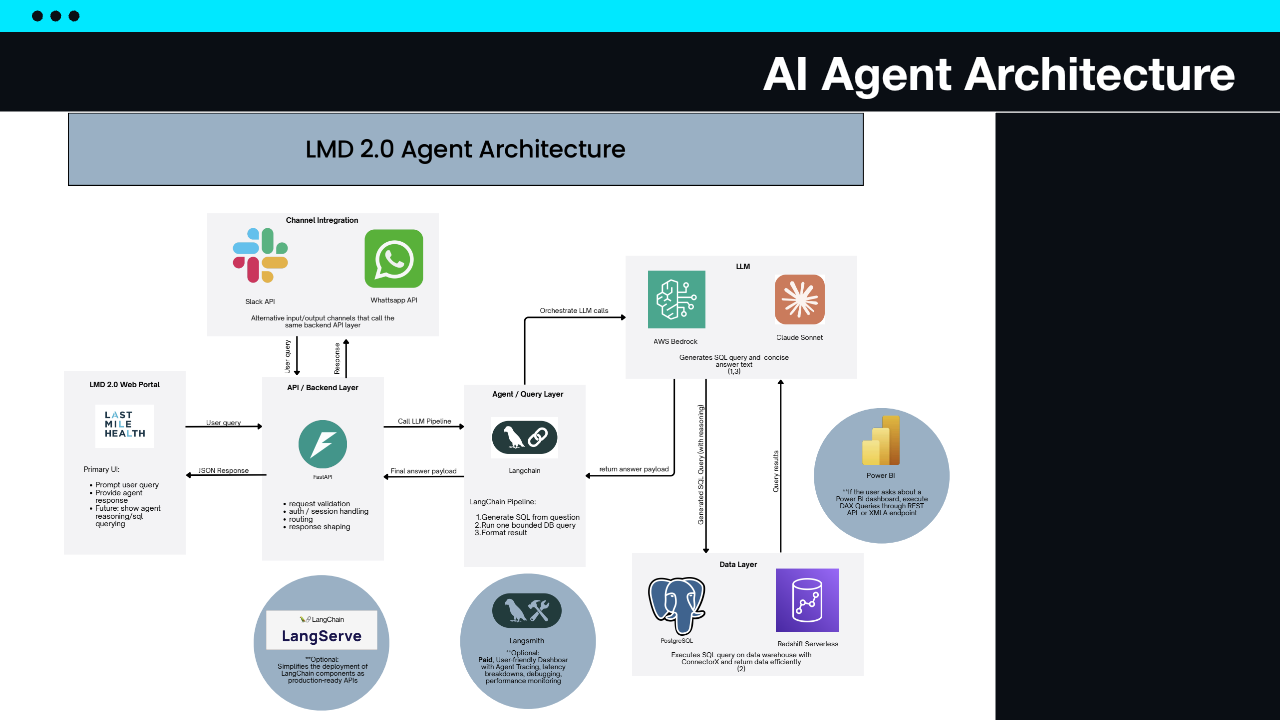
To achieve our project goals of reducing latency and adding context, we proposed a multi-agent system. Planning started with a sketch of the system, including a master agent routing agent, database schema retrieval, SQL generation agents, a deterministic SQL validation tool, and bounded correction loops prevent uncontrolled retries and burning API tokens.
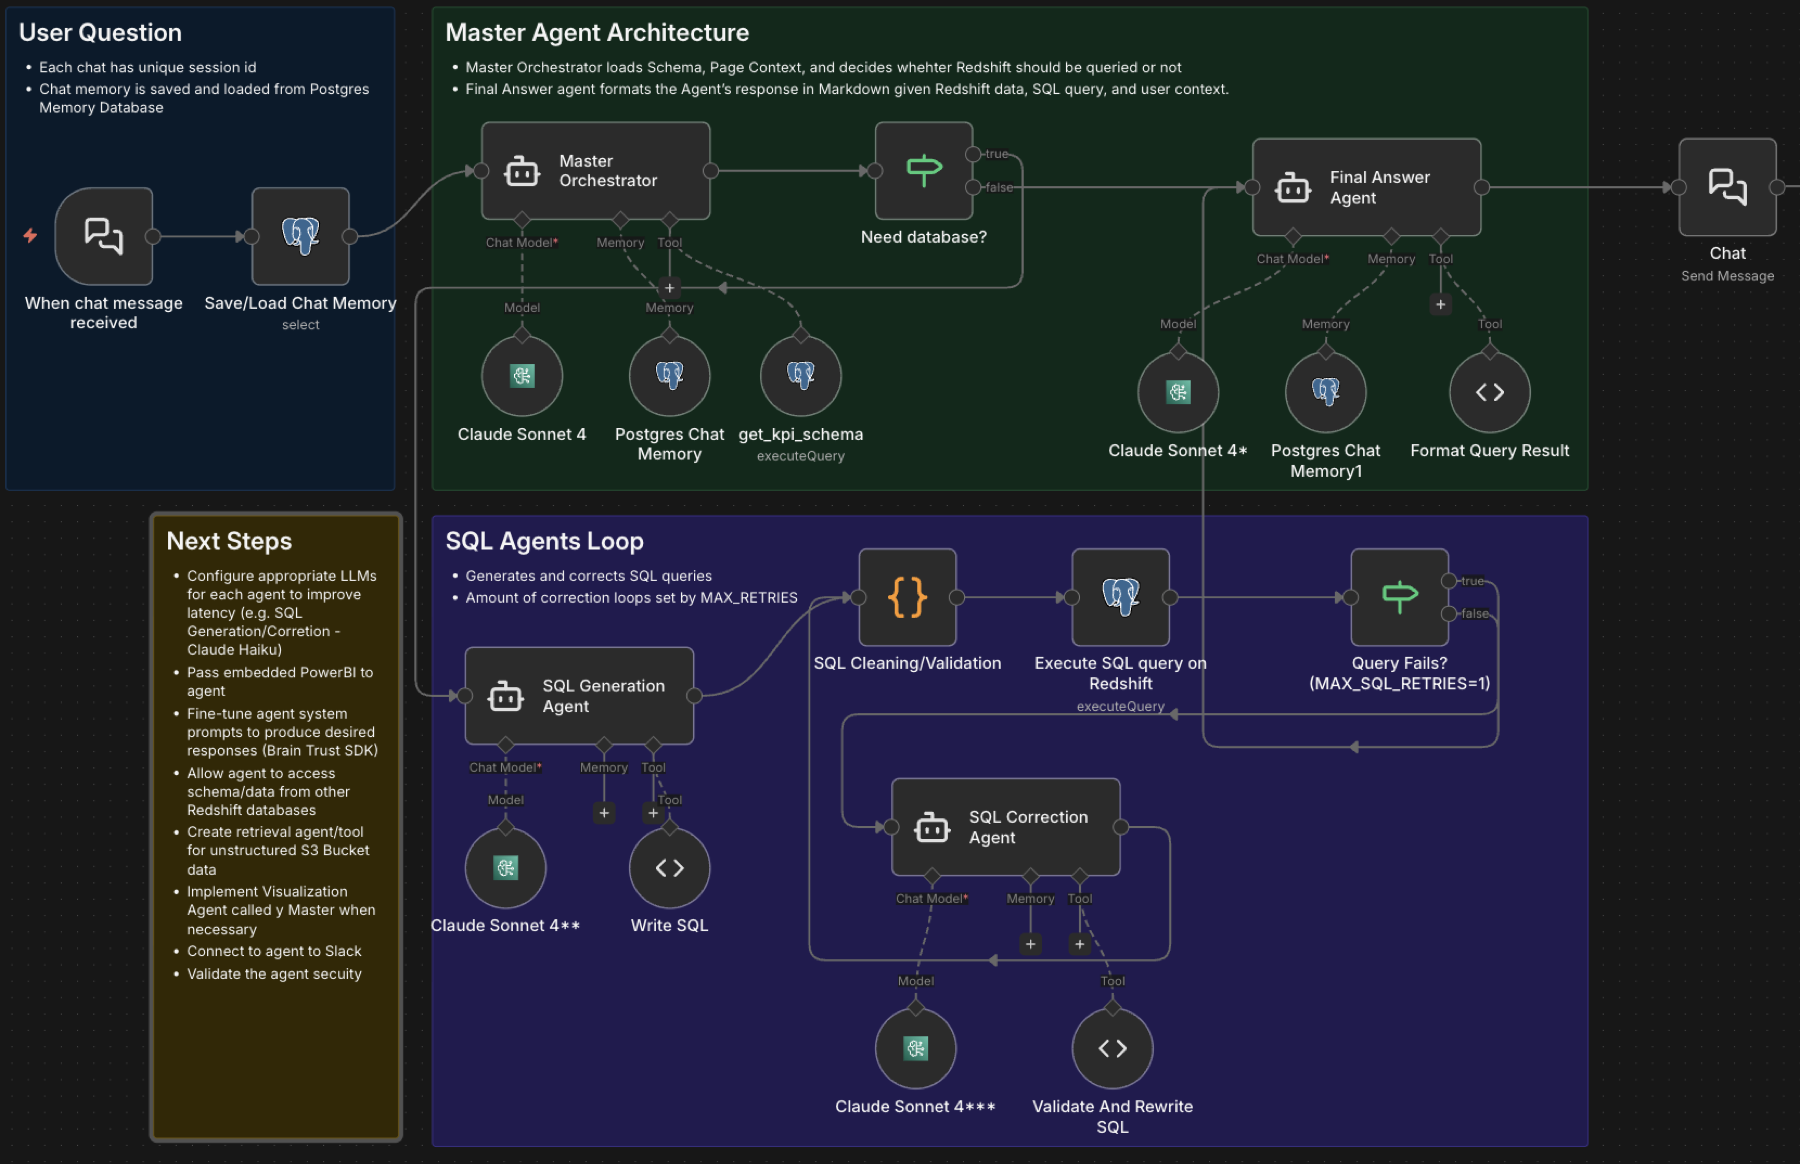
After sketching out the system, we drafted a demo of the system using n8n, a node-based AI orchestration platform, to test the efficacy of using multiple agents with deterministic tooling and present improvements to latency and accuracy before moving to production.
Architecture
Natural language to guarded SQL.
The workflow retrieves relevant schema context before generation, then validates and retries SQL in a bounded loop.
Portal sends message and optional dashboard page context.
Classifies whether database access and visualization are needed.
Searches cached Redshift schema metadata for relevant tables and columns.
Generates read-only SQL using only verified schema context.
Checks SQL safety and retries bounded corrections when appropriate.
Summarizes query rows and prepares preview-safe response metadata.
Associated Presentation
Last Mile Health: LMD 2.0 Agent
Final TGHI presentation covering the LMD 2.0 agent concept, implementation narrative, and project handoff.